

Jump to Section
Introduction, Project Objective, Data Sources, Assumptions, Importing and Cleaning, and Merging the Data, Exploratory Data Analysis (EDA), Figure 1, Figure 2, Figure 3, Figure 4, Figure 5, Figure 6, Figure 7, Figure 8, Figure 9, Figure 10, Figure 11, EDA Summary, Model Building, Figure 12, Figure 13, Model Results and Evaluation, Figure 14, Figure 15, Figure 16, Figure 17, Conclusion, Future Work, More Information
Introduction
Fake news is a very hot topic these days after the 2016 U.S. Presidential election. Facebook and Google are responding with their own actions to reduce the spread of fake news, including down-ranking in search results and pulling advertisement funds[1,2]. The technological challenge of automatically tagging fake news without thoroughly cross-checking statements-a task only a human can accomplish well at this time, is a serious obstacle to preventing the spread of fake news [3]. Excited by the opportunity to address this unique and challenging (real-world) problem, I found the inspiration to tackle the following project.
Project Objective
My project analyzed posts from Facebook news pages between August 26th, 2016 to January 20th, 2017, to explore the effects the election had on posting and engagement by type of news. Additional supporting project objectives included:
-
Identify some of the factors that could uniquely identify whether a shared Facebook news post is from a mainstream, fake, conspiracy, or satire source. I suspect that the differences between fake, conspiracy, and satire sources are subtle, and, therefore, the potential minute differences between them would need to be inspected more closely than merely an inspection between mainstream and fake news. For this reason, a multiclass inspection over a binary one (i.e. fake and not fake news) is preferred in this project.
-
Leverage differences between types of news to build a multiclass logistic regression model that tags a shared Facebook news post by type using important one or two word series, a.k.a monograms and bigrams, from post messages (e.g. “#neverhillary”, “follow american”), patterns in engagement activities (e.g. the proportion of likes out of the total number of Facebook reactions, shares, and comments for a post), type of post attachment (e.g. image, video, none, etc.), and various factors of time (i.e. day of week, hour of day, and timing of election [i.e. before, same day, or after]). A regression model is appropriate for the purposes of this project to identify the most important model features by examining model coefficients. The value of an appropriately calibrated model could help Facebook identify what posts to flag for taking actions to disincentivize the dissemination of fake news or for use by computational journalists to track the issues related to fake news to meet future reporting responsibilities.
Data Sources
My dataset was assembled by taking the following steps:
- A list of mainstream news sites was generated using a Pew Research study published on October 21, 2014, Political Polarization & Media Habits: From Fox News to Facebook, How Liberals and Conservatives Keep Up with Politics. Comprising the list were well-known sources more trusted than not by the general public as identified in Pew’s study.
- Two sources were used to generate a list of fake, conspiracy, and satire news sites. A list of fake, conspiracy, and satire news sources compiled by Dr. Melissa Zimdars of Merimack College was cross-checked against against a list of news sources by the corresponding target types and unknown types from a fake news Kaggle dataset compiled in October and November of 2016 using the BS (“bullshit”) Detector Chrome Extension from Daniel Sieradski. All news sources listed as fake, conspiracy, and satire in Dr. Zimdars list were inspected for Facebook pages unless the news label explicitly conflicted with the news label of the sources in the Kaggle dataset. To focus on U.S. media, various known foreign pages were excluded, although all foreign pages were not entirely eliminated.
- All news postings were retrieved from the Facebook pages of mainstream, fake, conspiracy, and satire sources via the Facebook Graph API.
Assumptions
- The list compiled by Melissa Zimdars have Facebook posts consistent with the category assigned when examined as a whole. A mainstream news post contains accurate information with the intent of informing the reader about a current event. A fake news post contains inaccurate information with the intent of misleading the reader. Conspiracy does not contain information that can be verified with an unknown or unapparent intent. Satire may contain inaccurate information and/or perhaps unverified information with the intent of humoring or entertaining the reader.
- Proxies for thoroughly cross-checking and verifying the validity of statements/accounts, i.e. good journalism, and inferring intent can predict the type of news.
- A model built on a skewed sample can be used to accurately categorize the news in the real world when the ratios of exposure to the type of news is changing and dependent on previous user engagement with information on Facebook.
- Each Facebook news post can be adequately, appropriately assigned to a unique category.
- The logit of the probabilities of the types of news are linear with respect to the model parameters.
Importing, Cleaning, and Merging the Data
The following steps were taken to download and clean the data before performing exploratory data analysis (EDA):
- Post information was compiled to a local drive via Facebook’s Graph API by making modifications to a Python code provided by another programmer. The data extracted from Facebook included post message, title of link, type of link, post date, and individual counts of comments, shares, likes, loves, wows, hahas, sads, and angrys.
- Additional data columns were generated from the existing dataset or merged with known information to make a more detailed final dataset also showing Facebook page id, type of news page (i.e. mainstream, fake, conspiracy, or satire), day of week, hour, timing of election, and sum of all user engagement activities (i.e. sum of comments, shares, likes, loves, wows, hahas, sads, and angrys).
- All text was converted from unicode to string format.
- 99 of the posts were identified as redundant (0.04% of the total), so these were removed.
- All urls were removed from post messages to avoid selecting when identifying important monograms and bigrams from post messages.
The generation of important monograms and bigrams from Facebook message text is a key part of the model described in the objective. In detail, three steps were followed to generate the list of important monograms and bigrams from post messages. First, four lists of the most frequent 6,000 words for each type of news were generated using a count vectorizer. Next, values that represent the importance of words in a Facebook message considering the collection of messages from Facebook posts (a.k.a the frequency inverse document frequency (TF-IDF) of a word) were calculated and the 6,000 words with the highest TF-IDF scores were selected. The number of words was reduced again by selecting only frequently used words, but unique in usage to only one of the four types of news. The resulting list contained only 793 words. The list was further reduced to 505 words to remove meaningless words or ones that were closely associated with an individual page (e.g. the name of the page or the host of a particular news program).
Exploratory Data Analysis (EDA)
The following section explores characteristics of the dataset to better understand how the predictors perform in the final model.
The final dataset included over 274 thousand posts and over 900 million engagement activities from 129 Facebook pages. Though the number of mainstream sites in the dataset were few, mainstream posts were the second most common type of post (Figure 1 and Figure 2).
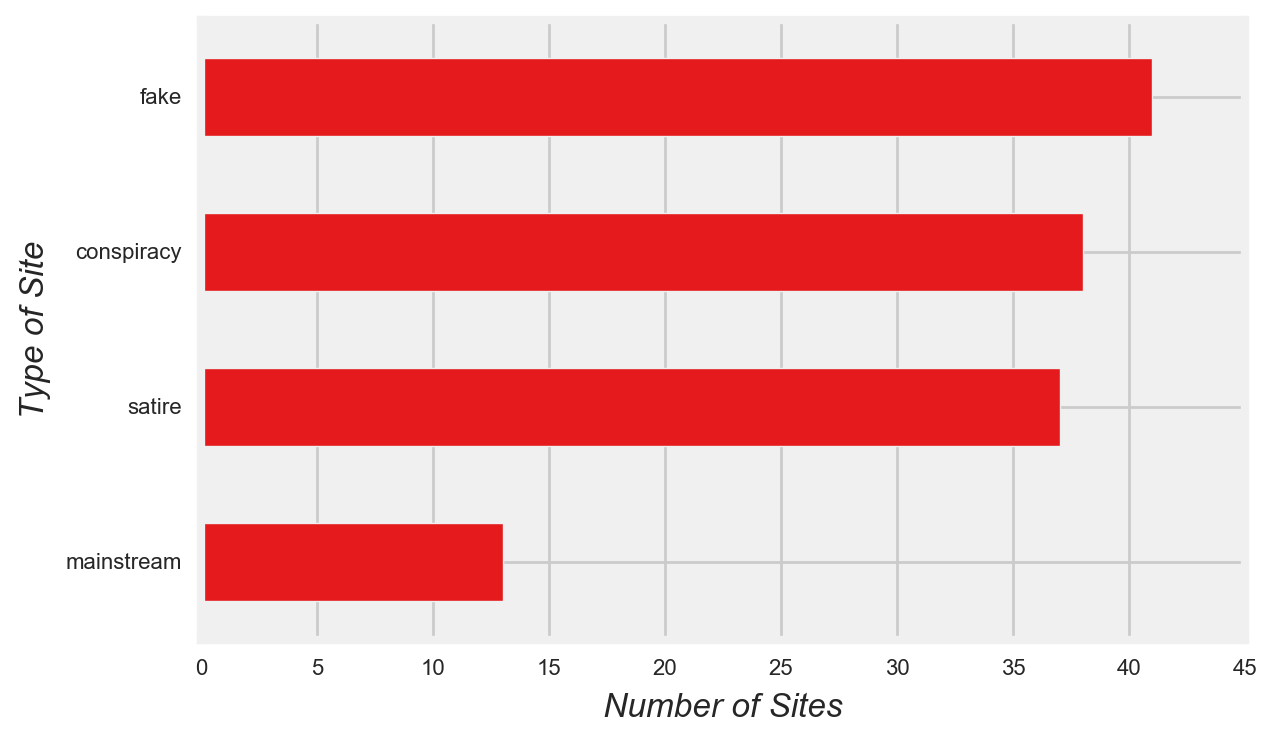
Figure 1
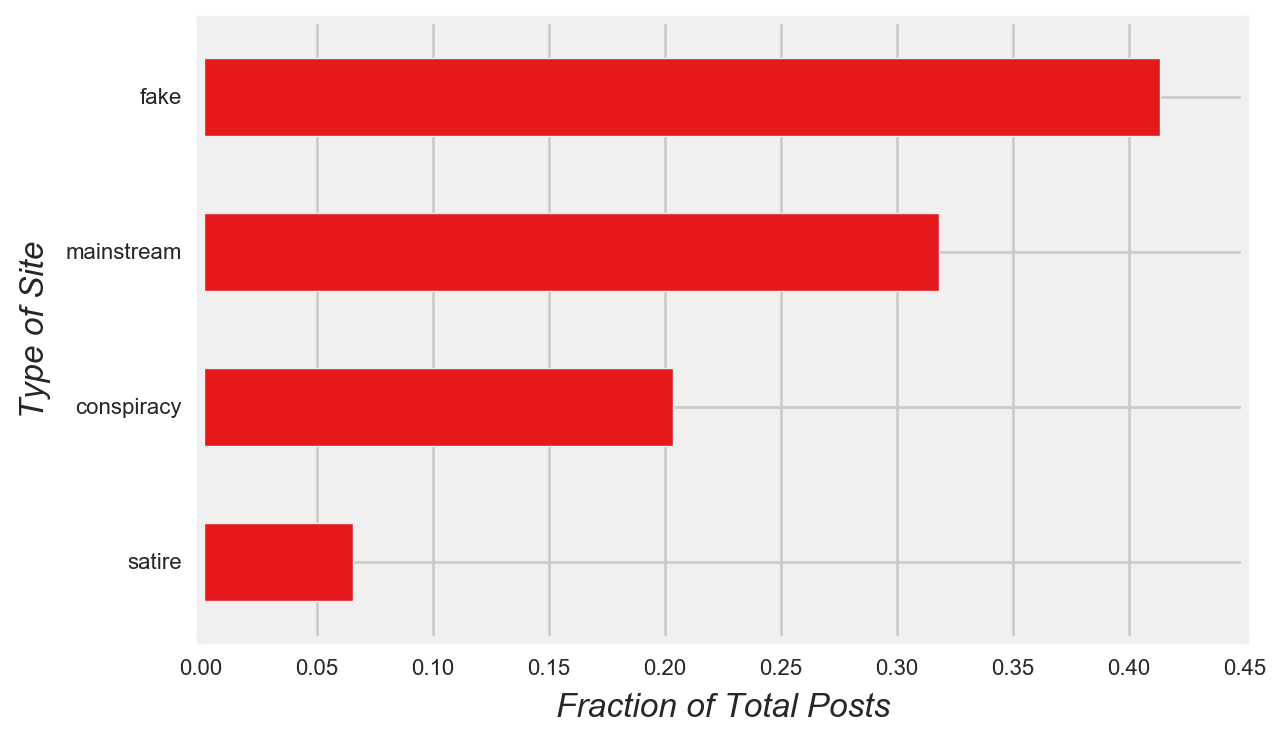
Figure 2
Furthermore, regardless of the type of news, only a handful of pages posted and received the majority of the engagement (Figure 3). Based on this observation, I expected a model built on the existing skewed dataset to perform disproportionately better for the sites with the most posts and the highest levels of engagement.
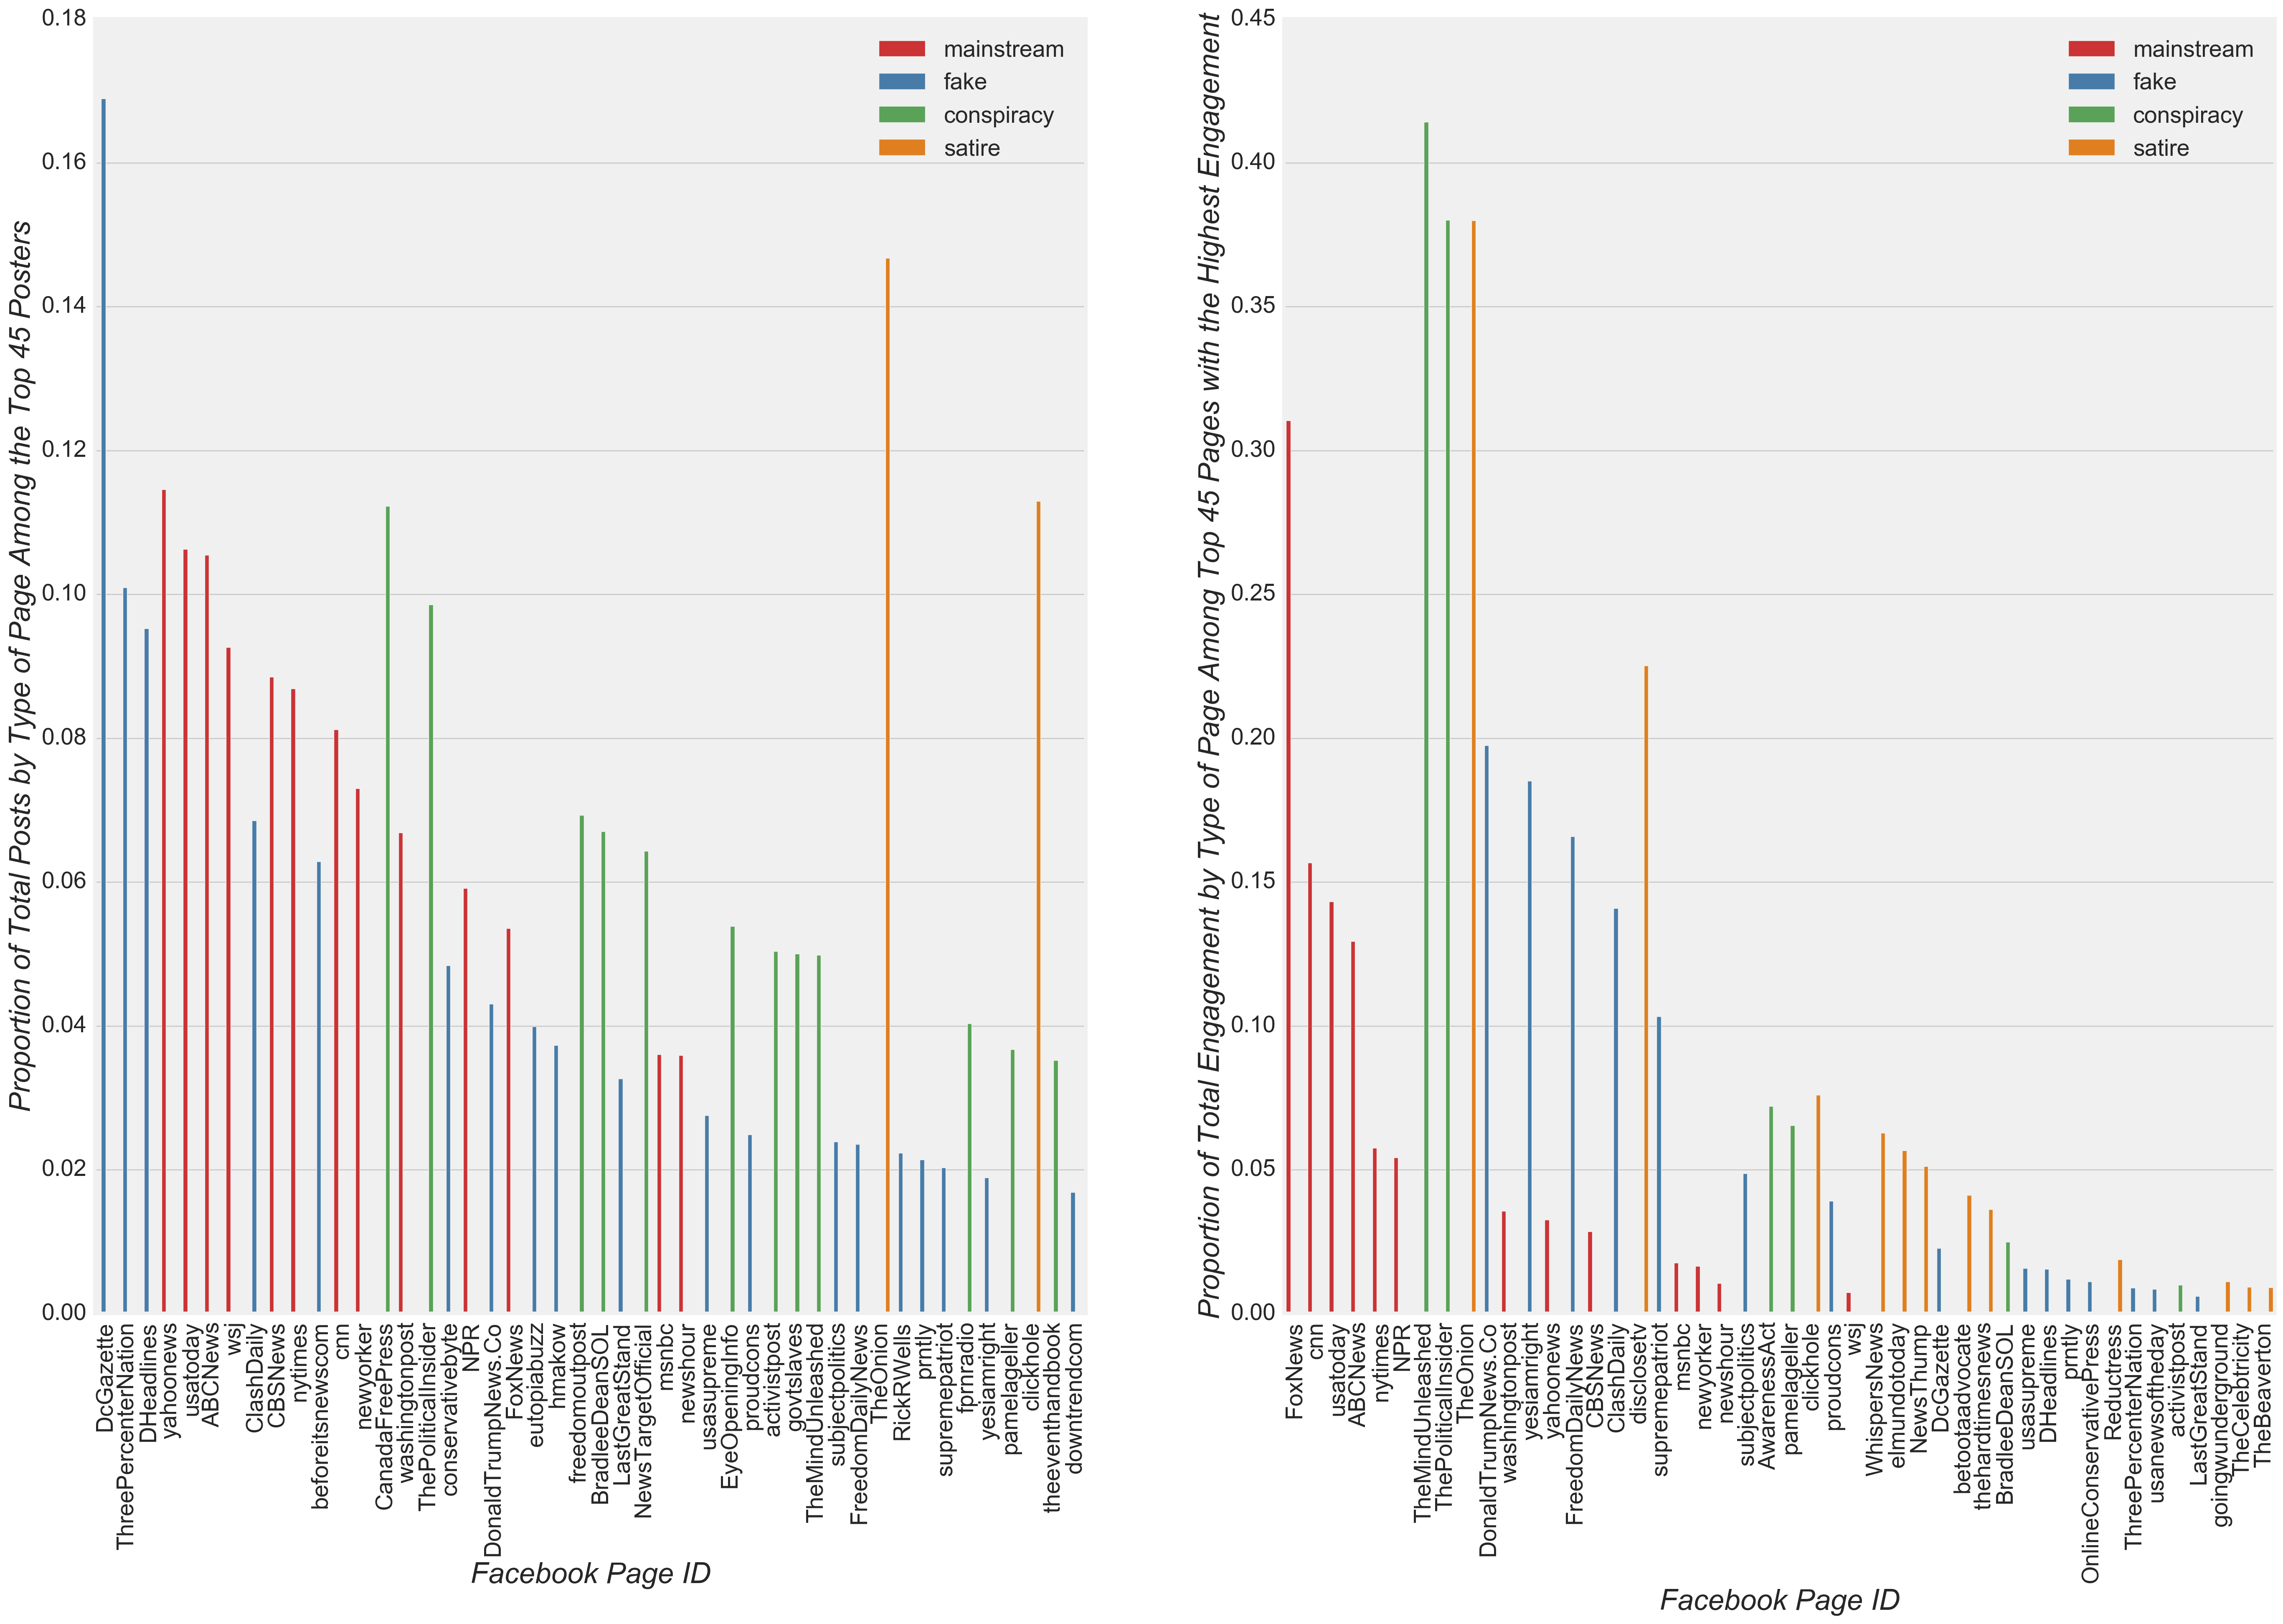
Figure 3
Now specific characteristics of model predictors are explored with respect to posts and engagement activities. If I observed differences in the patterns of posts among different types of news with respect to the various model predictors, I expected them to be reflected in the final model as high positive or negative model coefficients relative to zero.
To begin my evaluation of model predictors, I investigated the frequency of different post attachments and engagement levels by the type of news. Upon inspection, all types of news included posts with links more frequently than any other type of attachment, and all but conspiracy also showed links receiving the highest percent of engagement compared to all other types of attachment (Figure 4). However, with respect to the second most frequent type of attachment, mainstream pages had videos attached more frequently to posts compared to all other types of news. Therefore, I expected the model to show a relatively high coefficient for mainstream videos relative to the coefficients for videos from all other types of news.
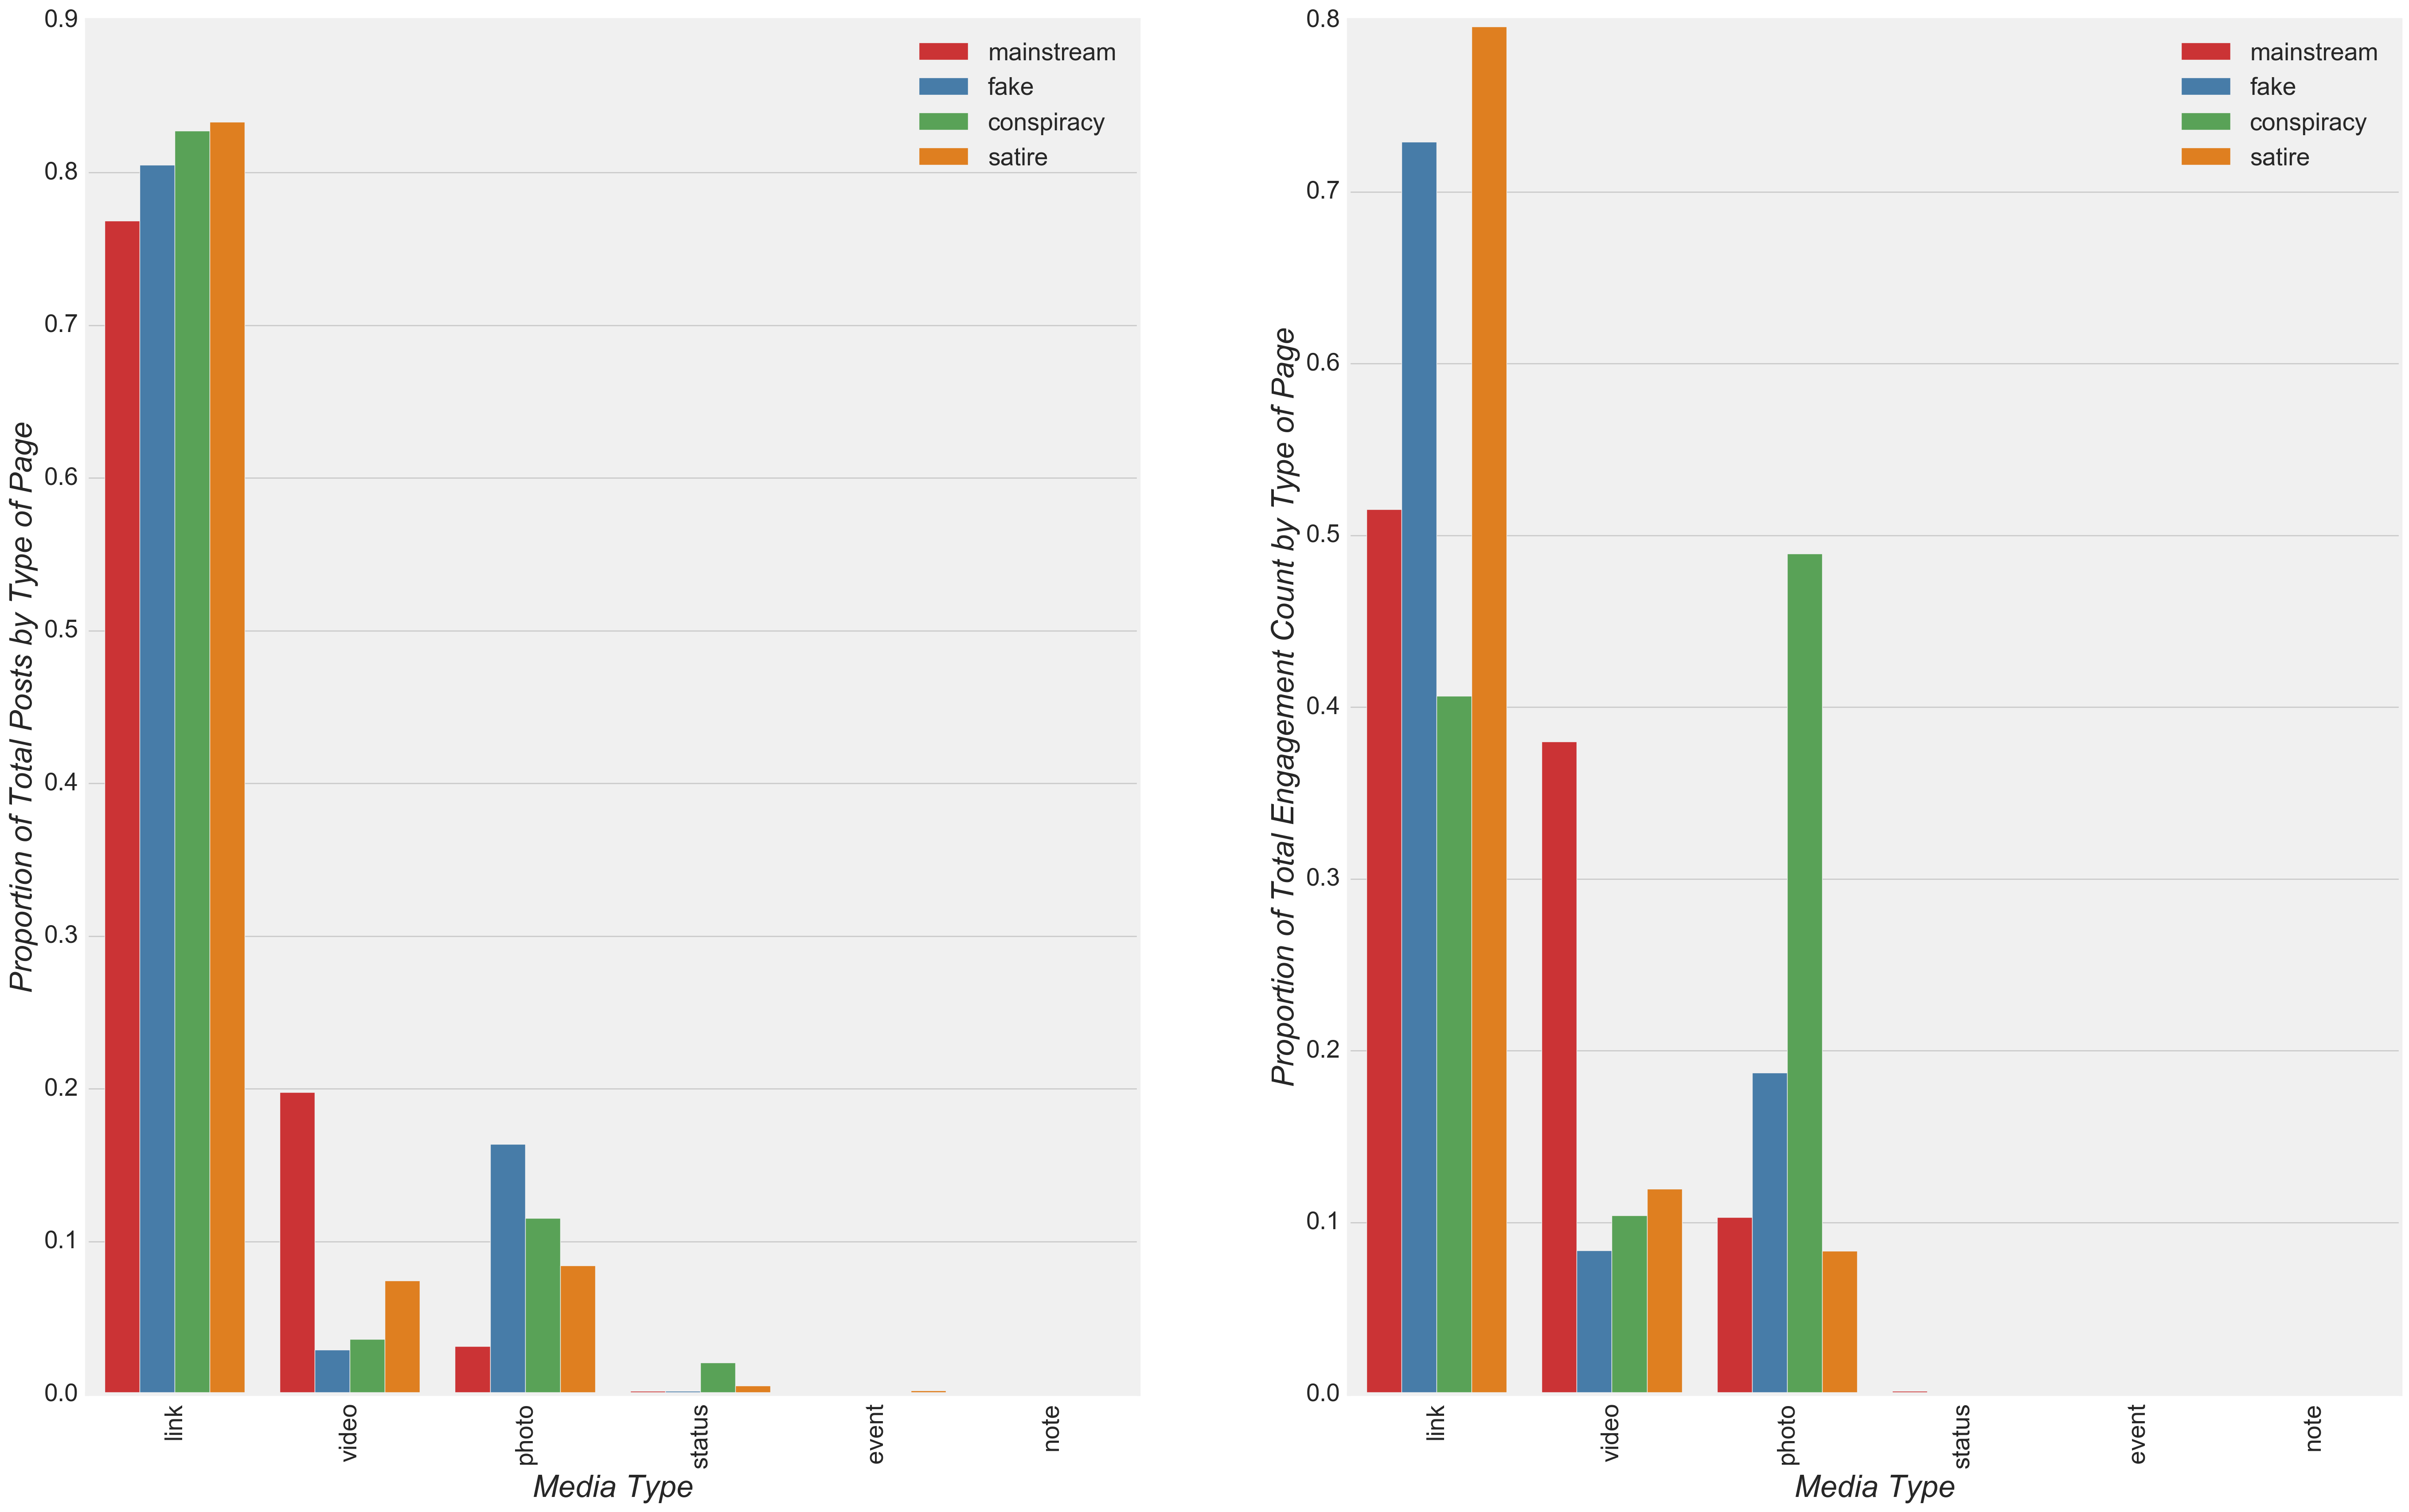
Figure 4
Next, I investigated the frequency of posts and level of engagement with respect to the U.S. Presidential Election. I observed that the most drastic change in the post volume occurred in the form of a reduction in fake news after the election, in large part due to a reduction in the post volume among the top three most prolific pages (Figure 5 and Figure 6). Due to the noticeable reduction in the percentage of posts from fake news after the election, I expected that the final model would have a relatively high pre-Presidential Election fake news model coefficient compared to the post-Presidential Election fake news model coefficient. Nevertheless, engagement activities associated with fake news increased drastically, second only to the spike in engagement among mainstream news-in part due to an increase in mainstream post volume (Figure 5). The spike in engagement to mainstream news occurred largely due to relatively high engagement with posts from CNN, ABC News, and USA Today (Figure 7).
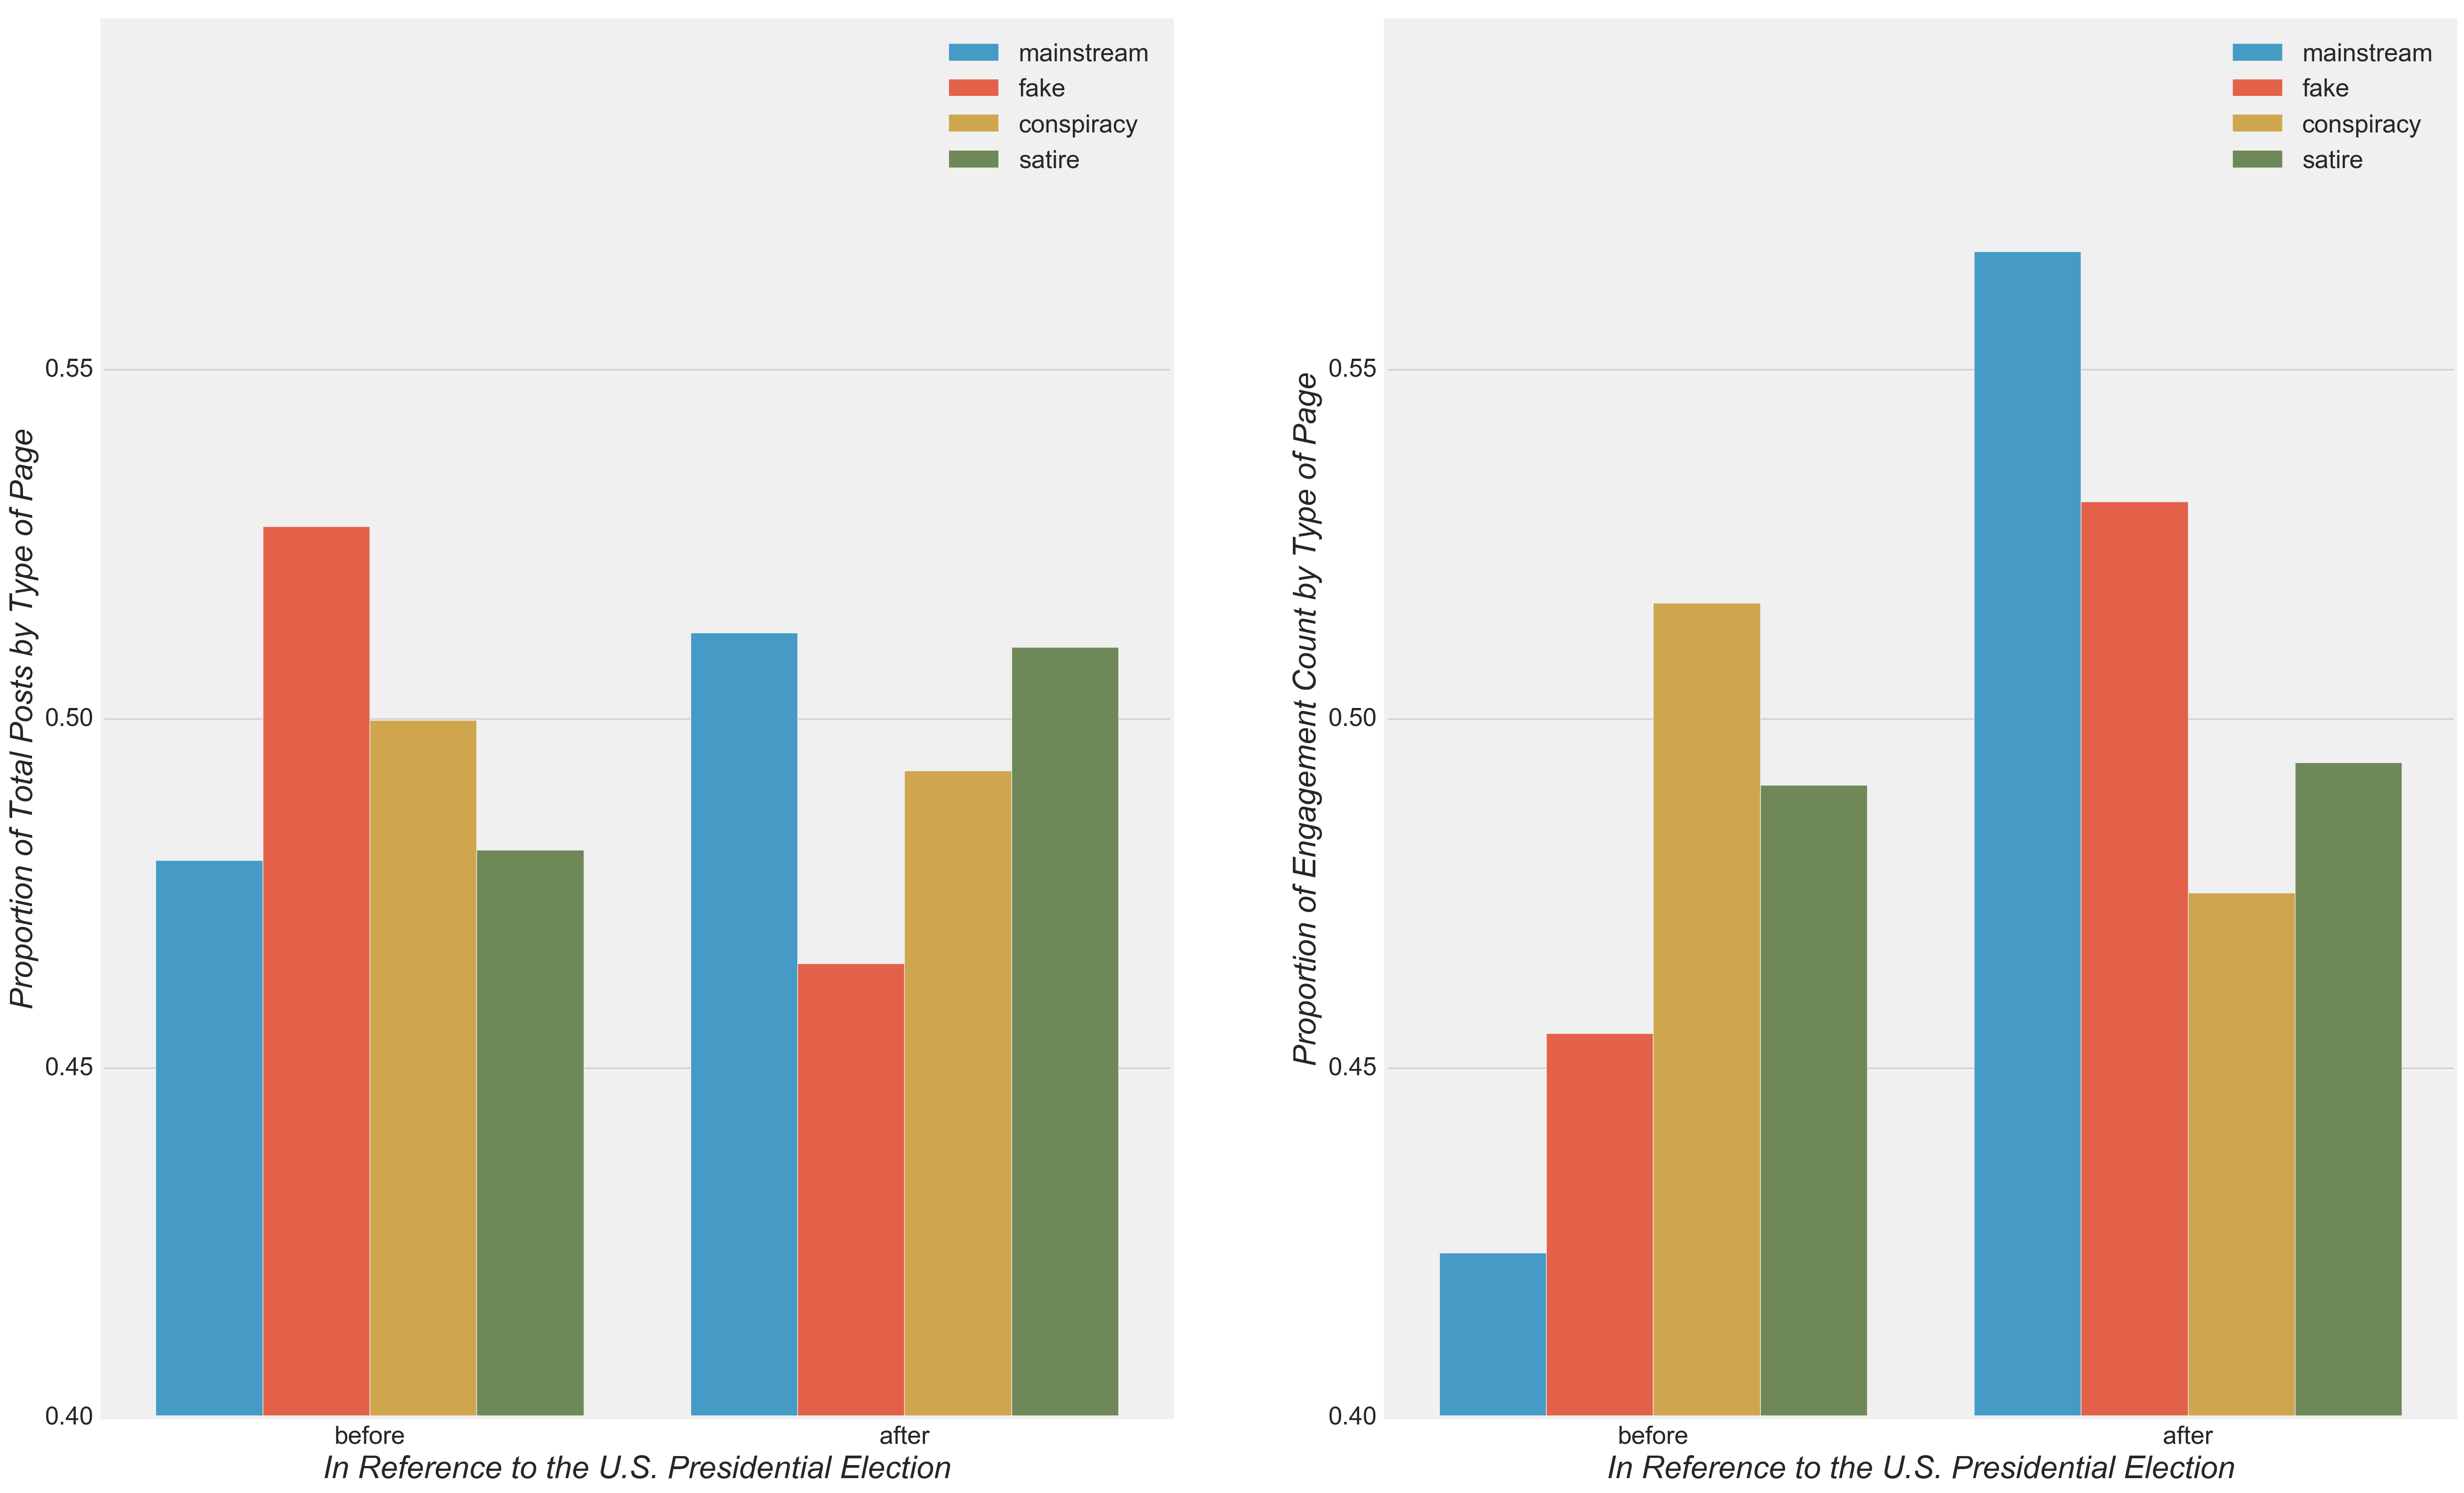
Figure 5
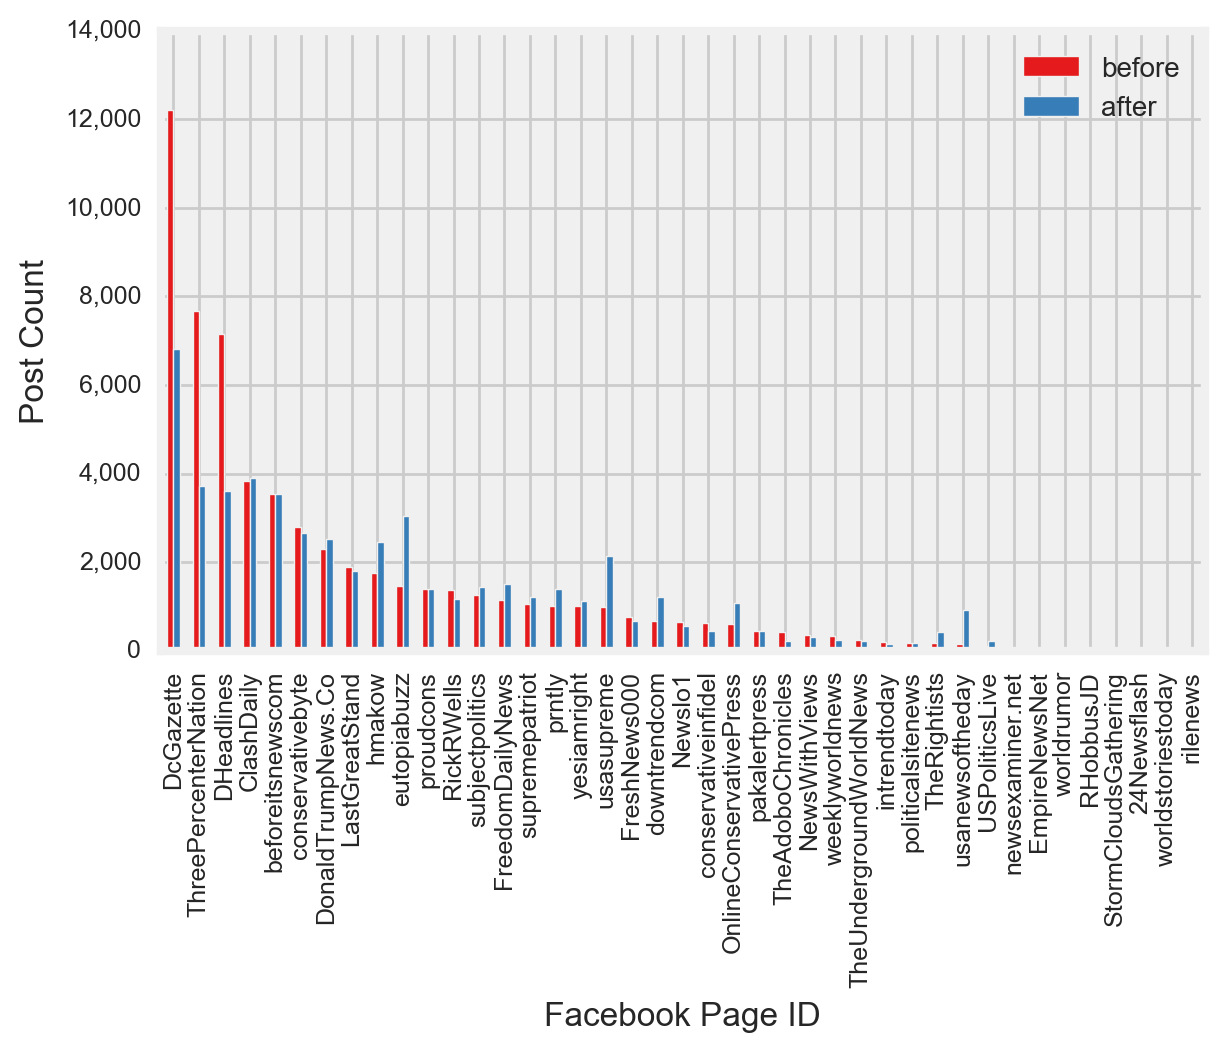
Figure 6
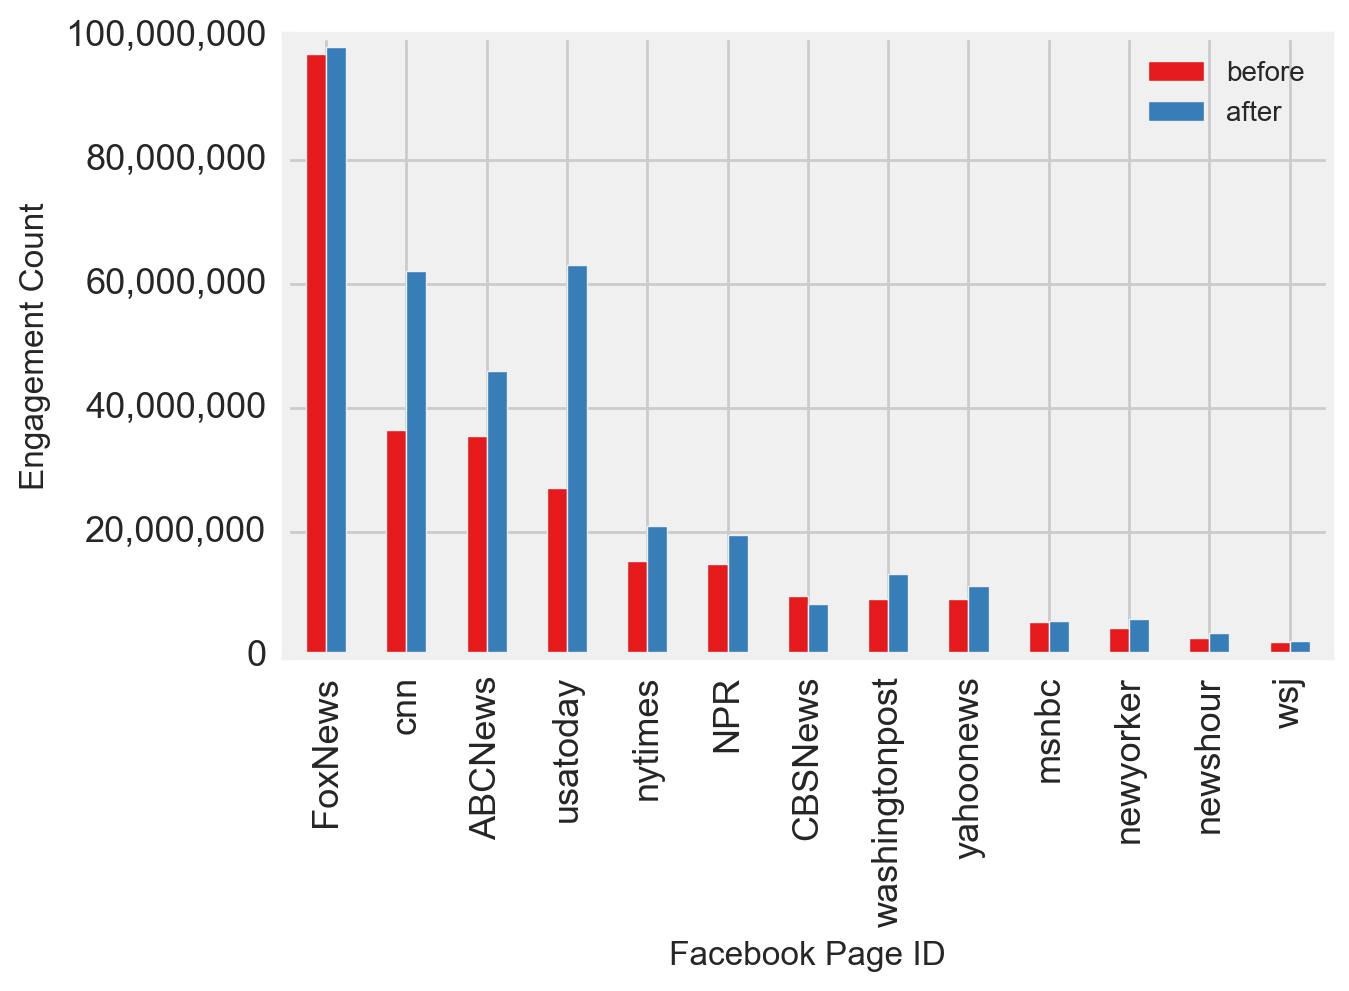
Figure 7
An inspection of the frequency of posts and level of engagement over the days of the week revealed a noticeable dip in the volume of posts and engagement activities on Saturday and Sunday relative to other days of the week regardless of the type of news (Figure 8). Due to the low variation of post frequency among different types of news throughout the week, I expected the model to show relatively low coefficients with respect to this predictor.
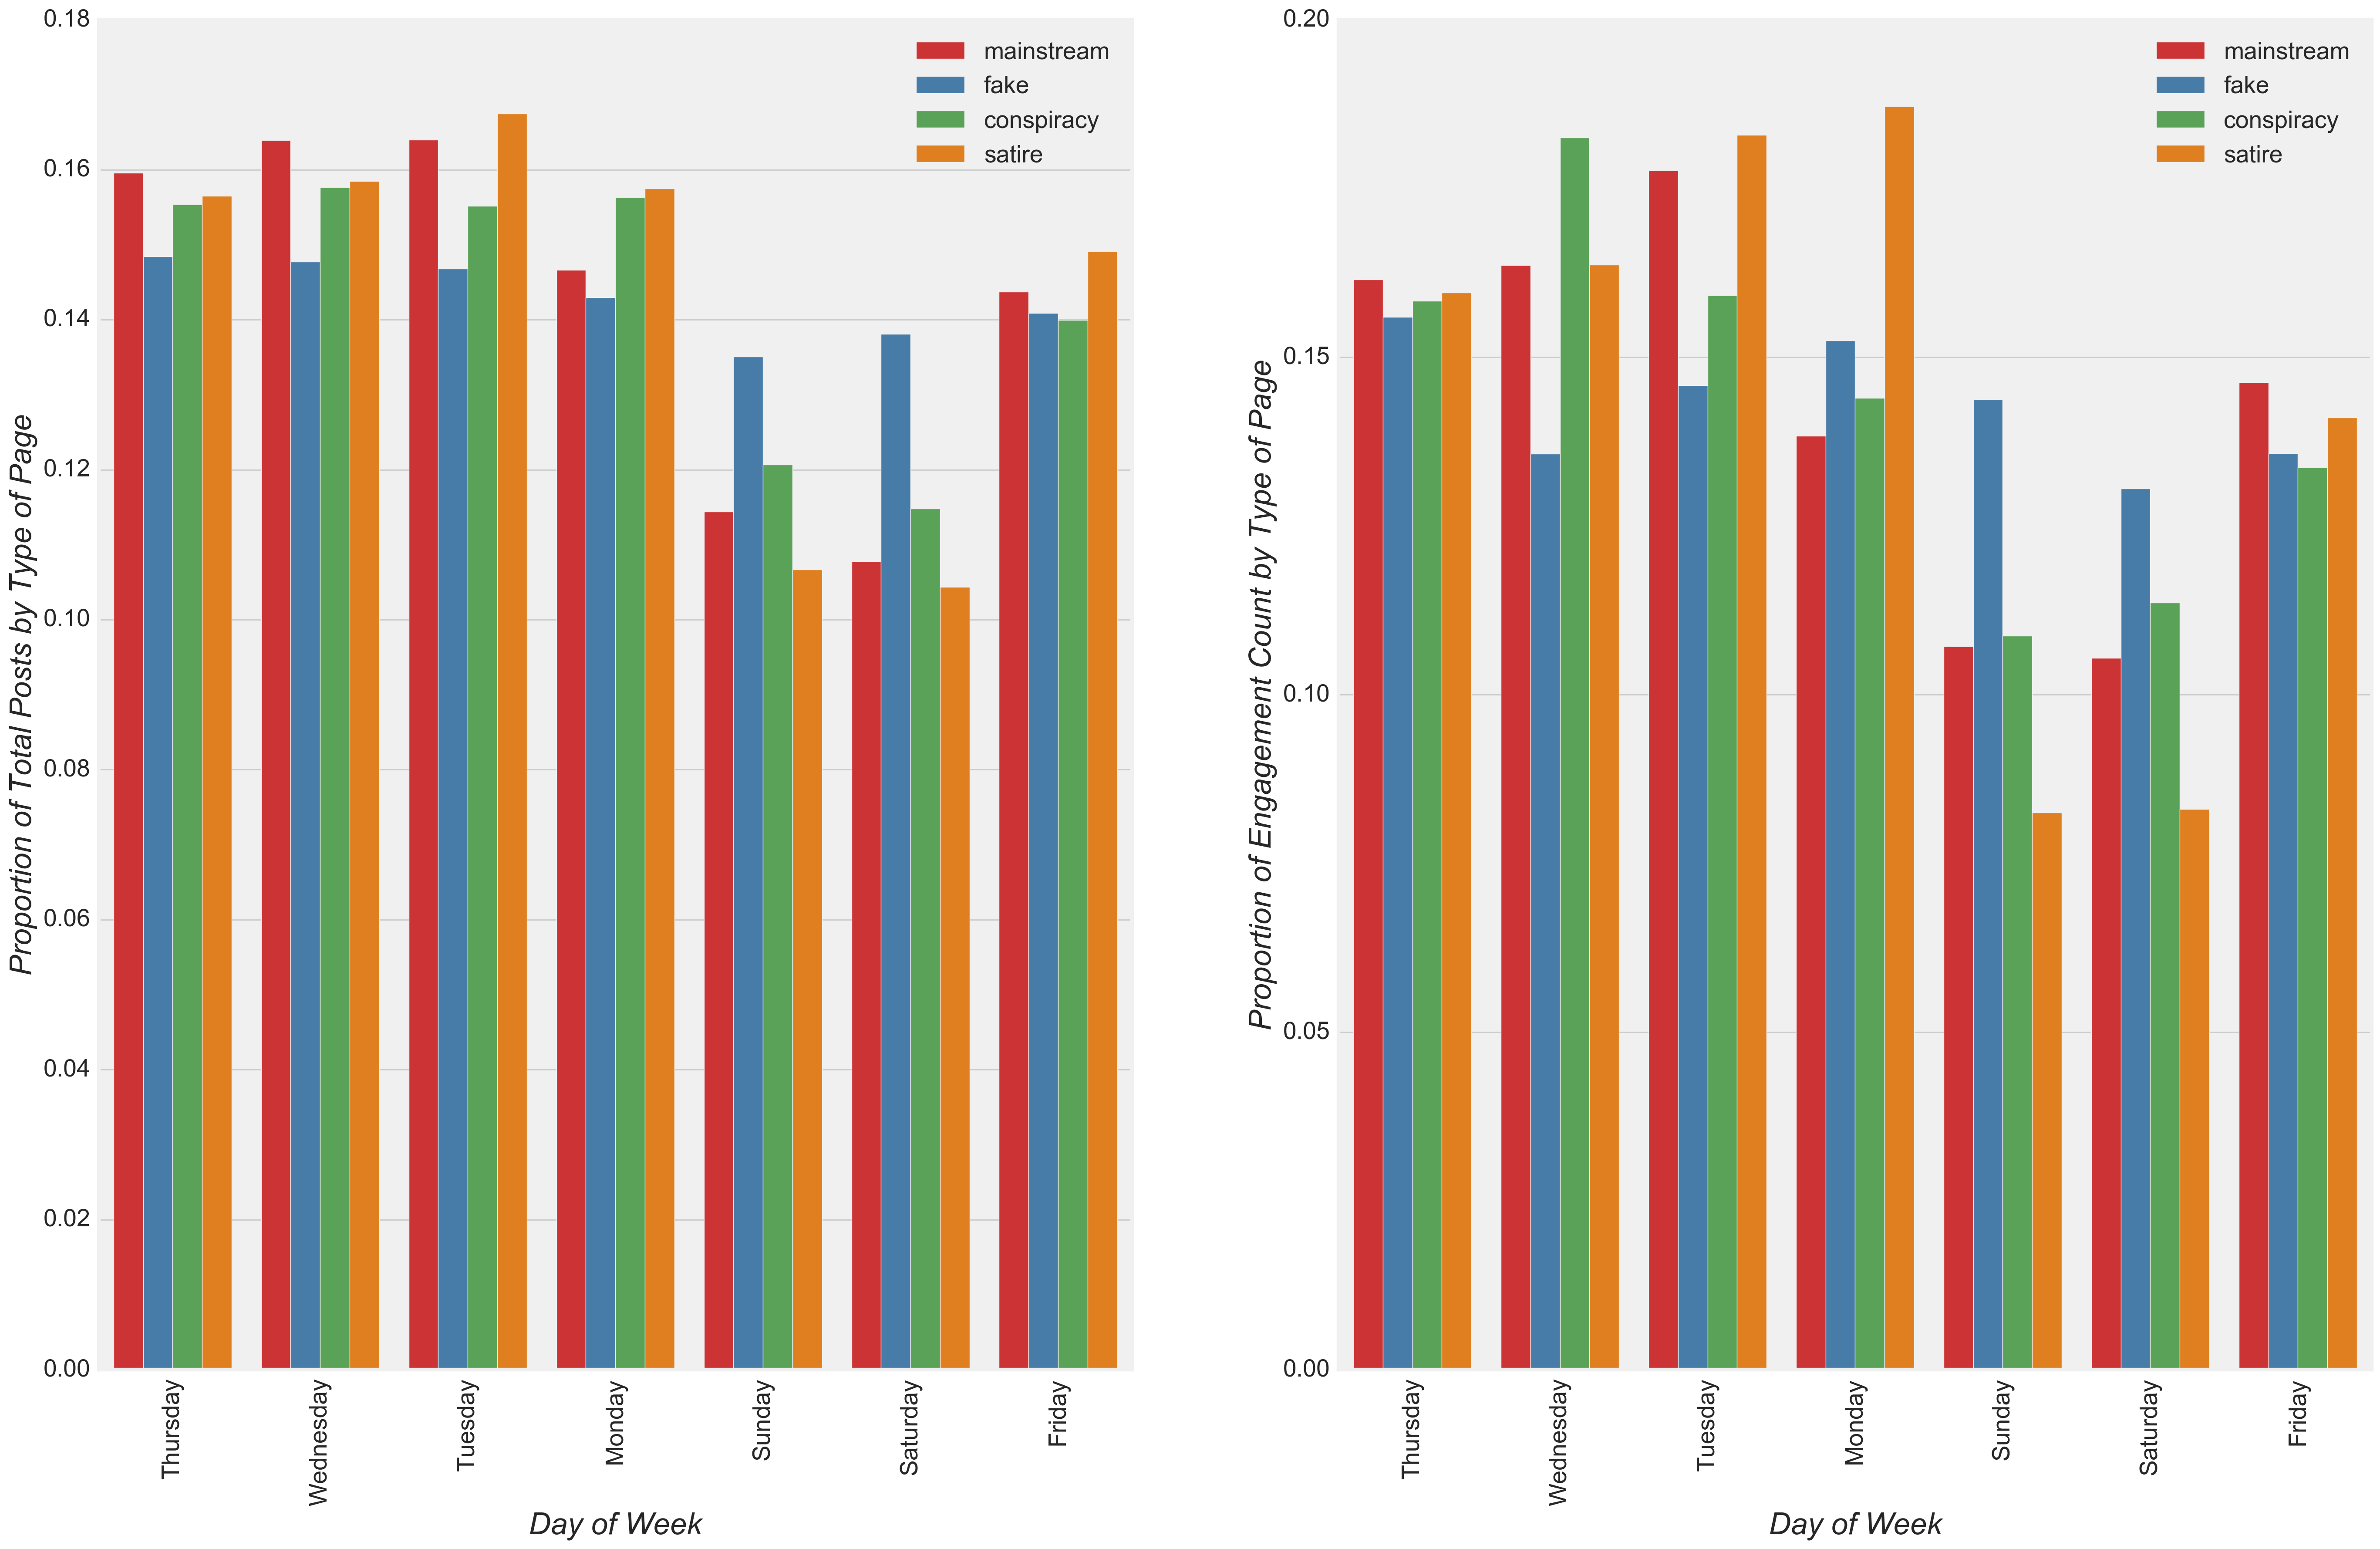
Figure 8
With respect to the hours of the day, posts showed a peak during working hours when considering the four time zones spanning the lower 48 U.S. states, regardless of the type of news (Figure 9). Differences in the posting time were relatively small between the different types of news with the exception of satire news, which showed a considerable peak between 6 am and 12 pm (Pacific Standard Time). With little difference in the pattern of posts over the hours of the day between different types of news with the exception of satire news, model coefficients for hours of the day for mainstream, fake and conspiracy news were expected to be relatively low in comparison to the model coefficient for hours of the day for satire news. Interestingly, engagement levels appeared relatively uniform over the hours of a day in comparison to post hours, indicating widespread engagement among users around the world and/or late night U.S.-based users. Relative to other types of news, engagement levels among conspiracy sites appeared to be most uniform across all times, while engagement levels among satire pages spiked at a time when posts peaked the most, i.e. between 6 am and 7 am.
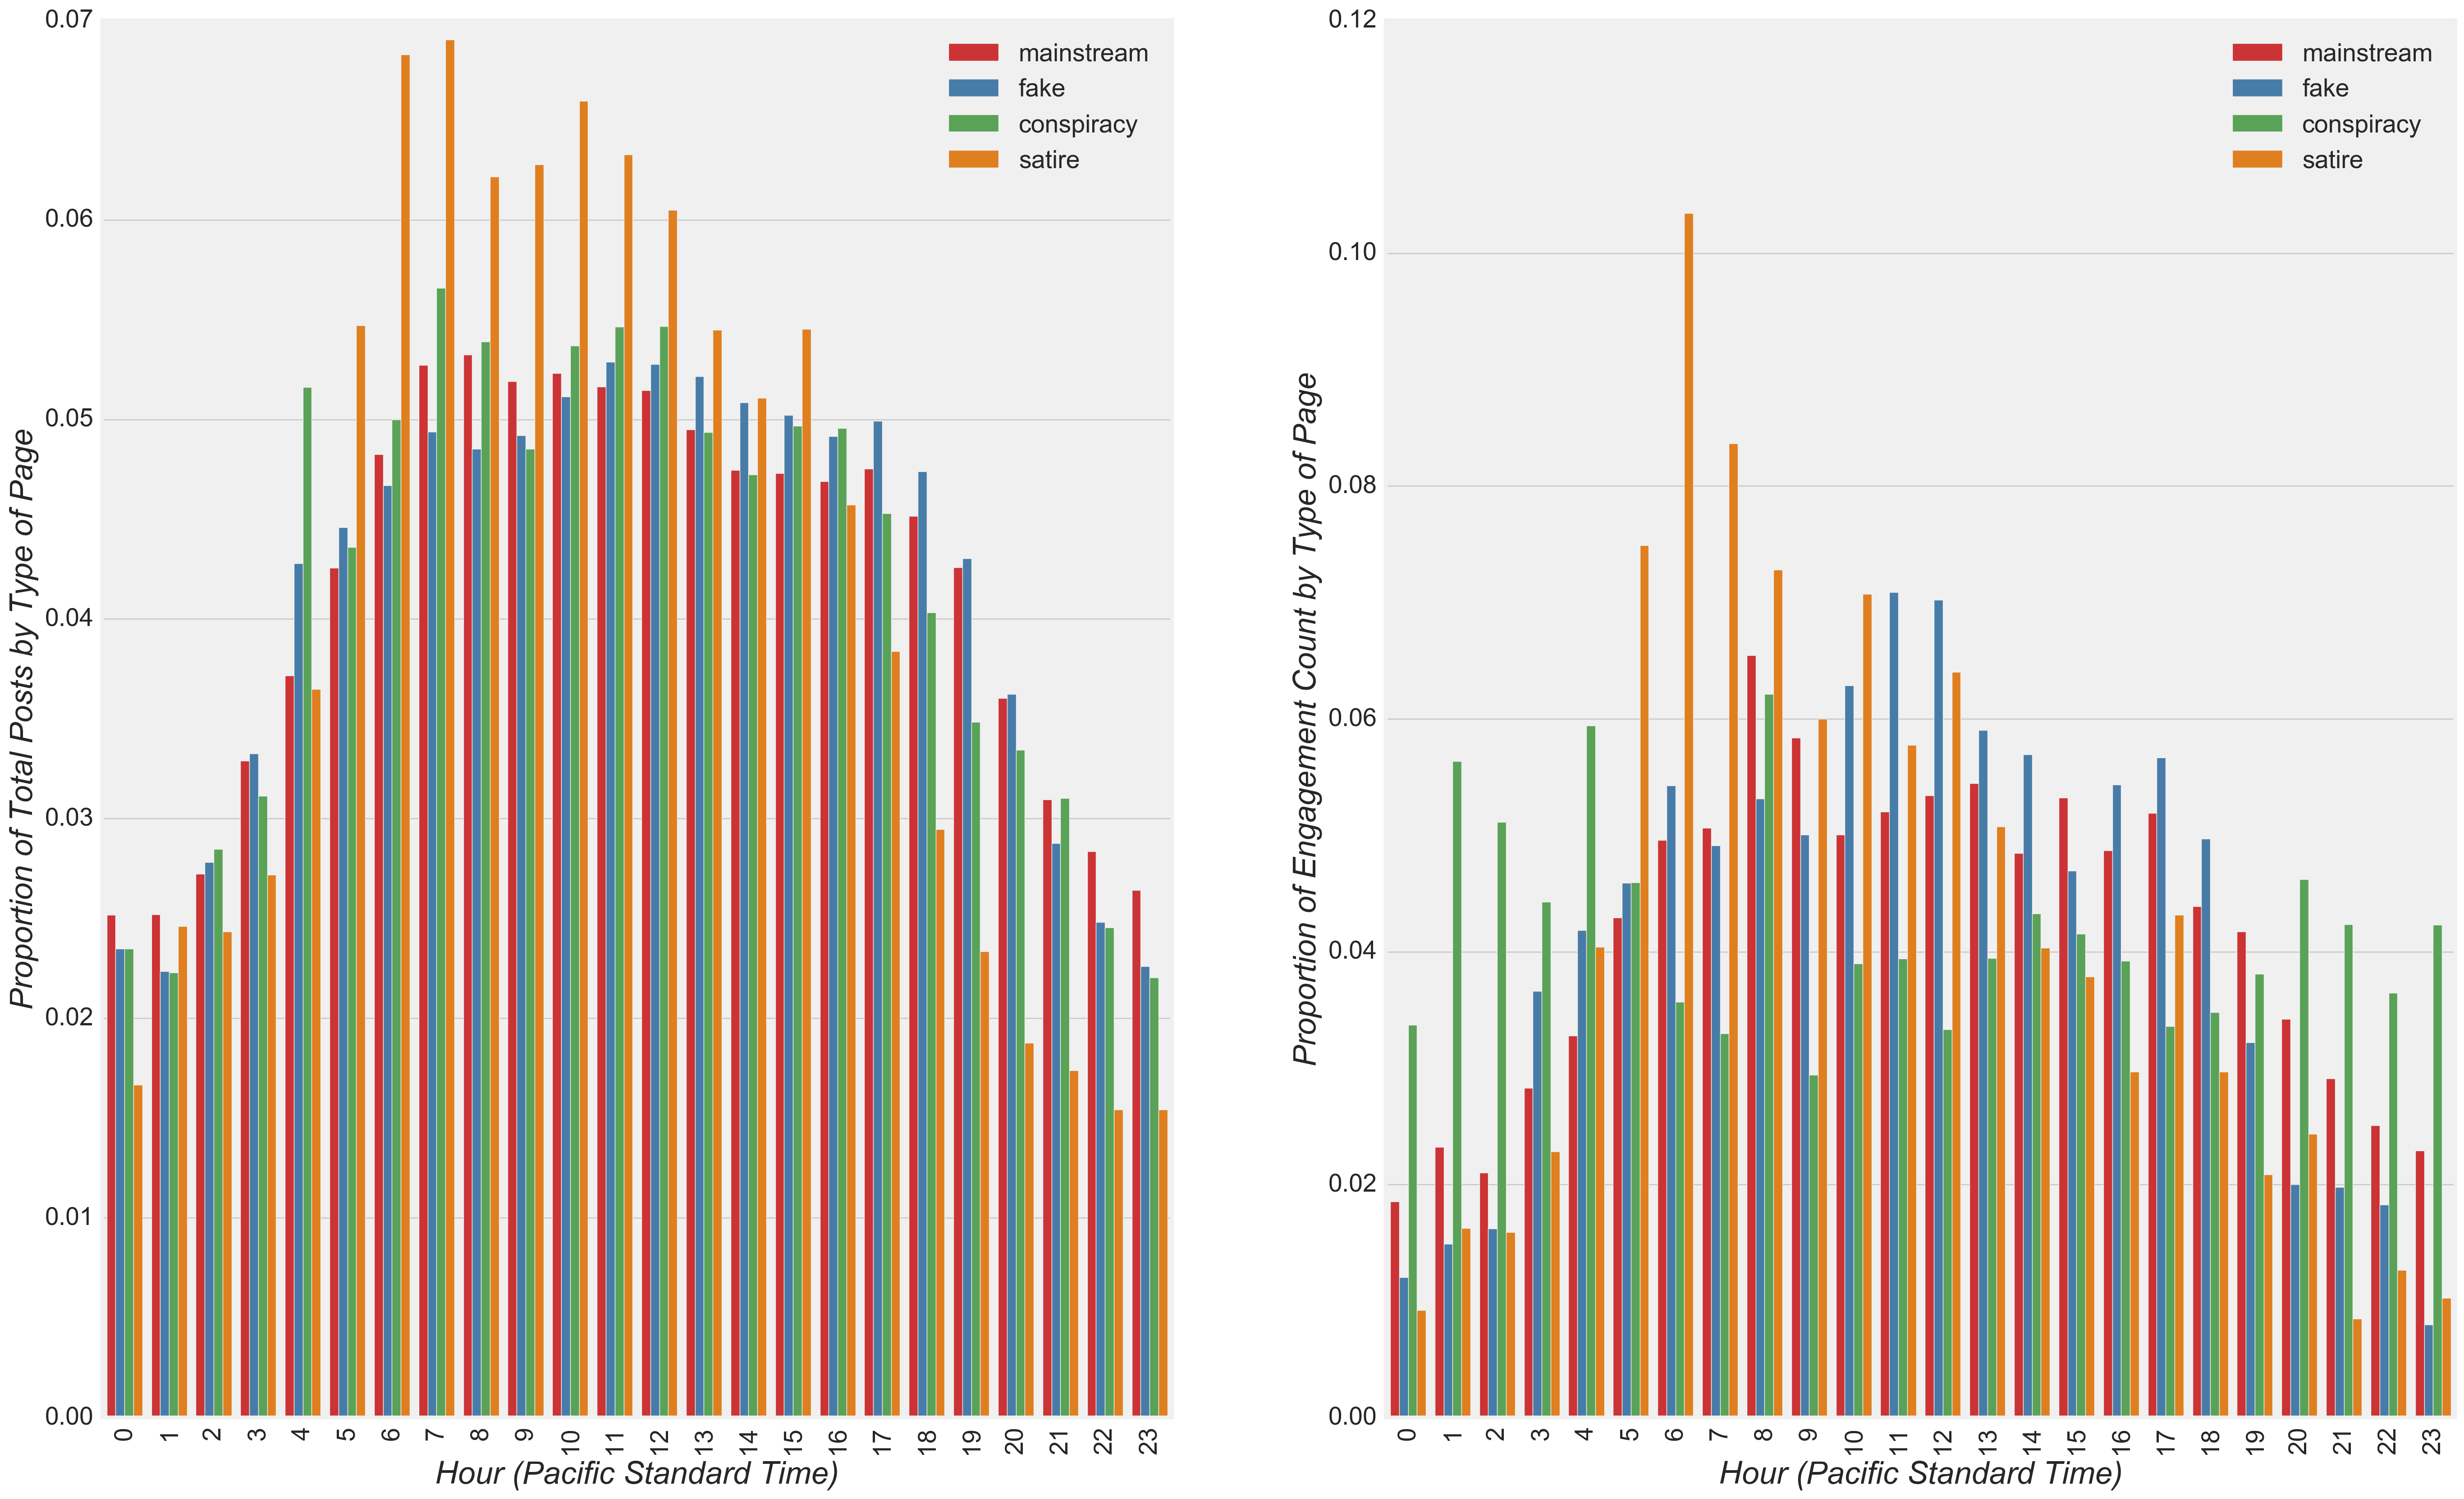
Figure 9
The model also included predictors for each type of engagement activity. To compare differences in the pattern of engagement activities among the different types of news, the value for such a model predictor was the proportion that a specific engagement activity occurred out of the total engagement activity in response to a post. An investigation of engagement activities by type of news and among the most highly engaged pages follows.
Like followed by share were the most common engagement actions in response to a post(Figure 10), although high variability in engagement actions were observed for all types of news relative to the mean value. Interestingly, satire showed the second highest mean engagement activity but had the lowest total engagement among all types of news. Perhaps unsurprisingly, satire had a noticeably higher mean number of hahas per post compared with the mean number of hahas per post for other types of news. Furthermore, haha was the second or third most common engagement response among individual satire pages (Figure 11). Therefore, I expected the final model to show a haha model coefficient for satire that was relatively high compared to the haha coefficients for all other types of news. Nonetheless, more satire posts were needed to better understand and compare with other types of news, because the project dataset contained far fewer satire posts relative to all other types of news (Figure 10).
Upon further inspection, other patterns also emerged. Share and comment were the second or third most common engagement actions from satire news pages or highly engaged mainstream news pages, i.e. Fox News. and cnn, but relatively less common as a proportion of other engagement actions among remaining mainstream sources (Figure 11). Among fake and conspiracy news, shares again were the second most common engagement type (sometimes the most common), and the proportion of shares in response to fake and conspiracy posts appeared to be greater relative to the proportion of shares among mainstream and satire news. Based on these observations, I expected the final model to have higher share coefficients for fake and conspiracy pages relative to the share coefficients for mainstream and satire pages.
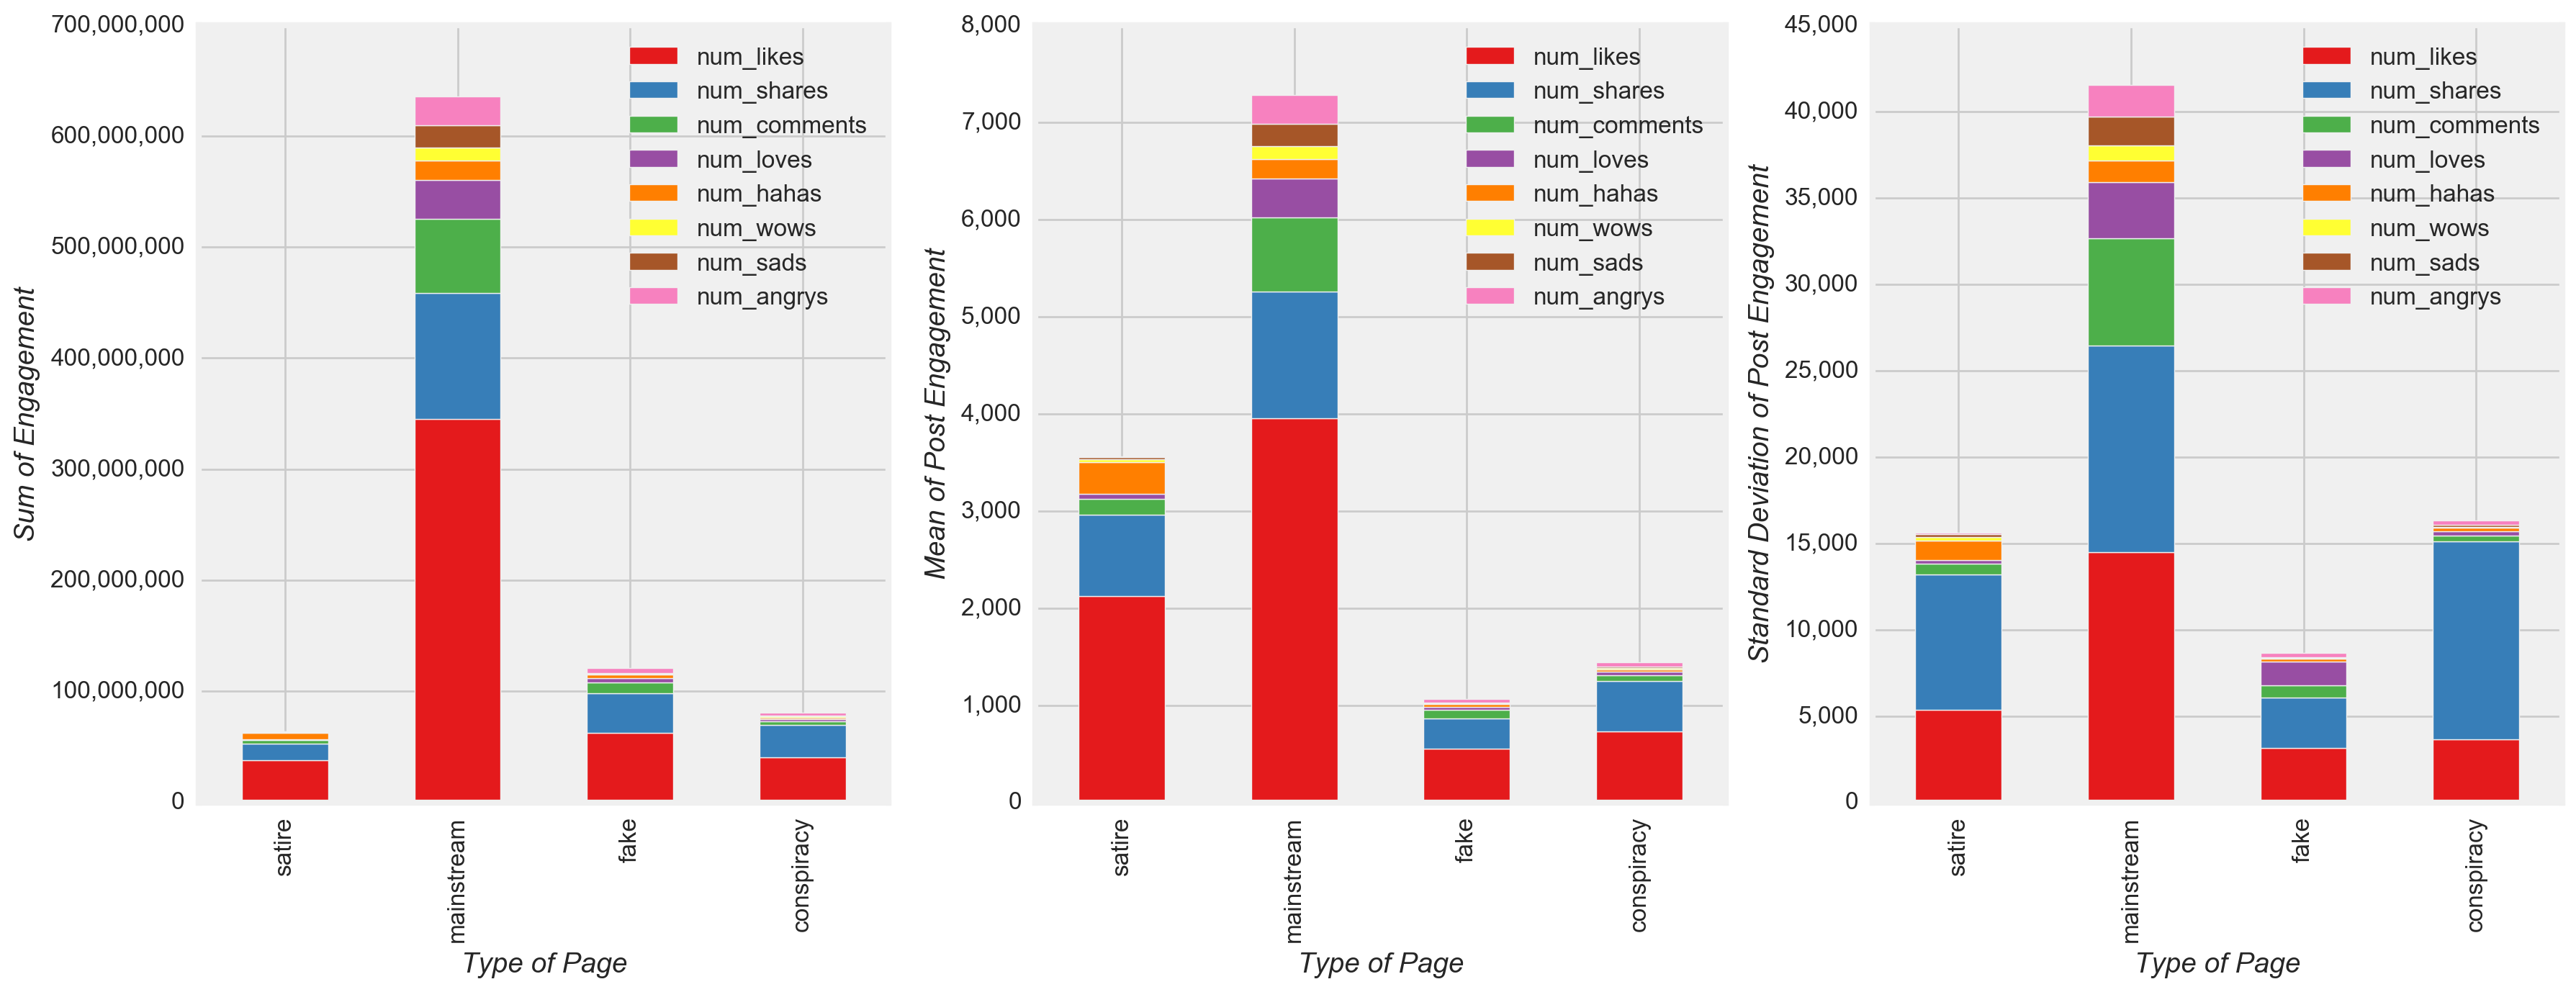
Figure 10
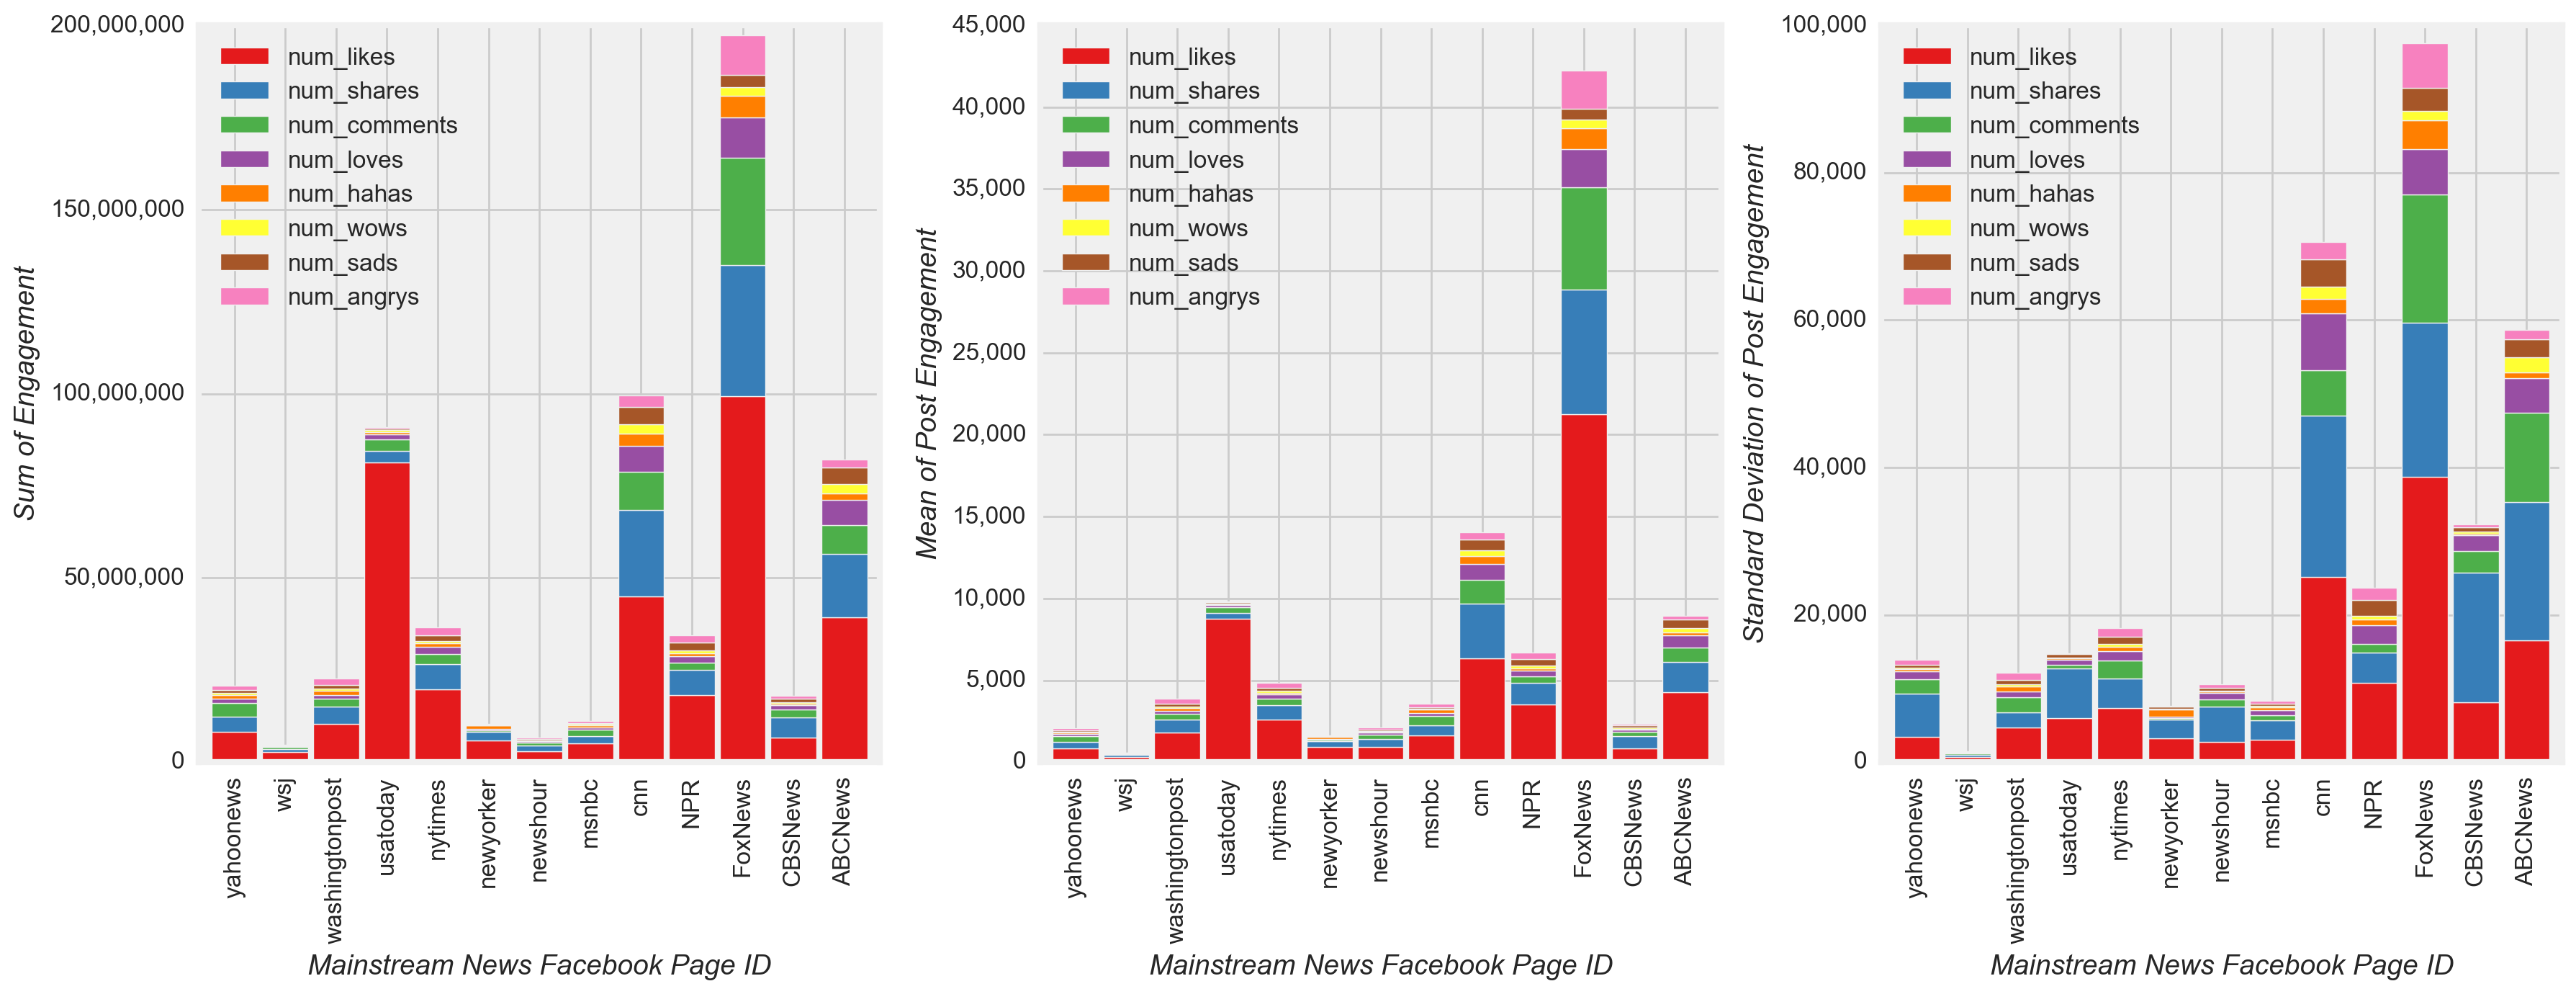
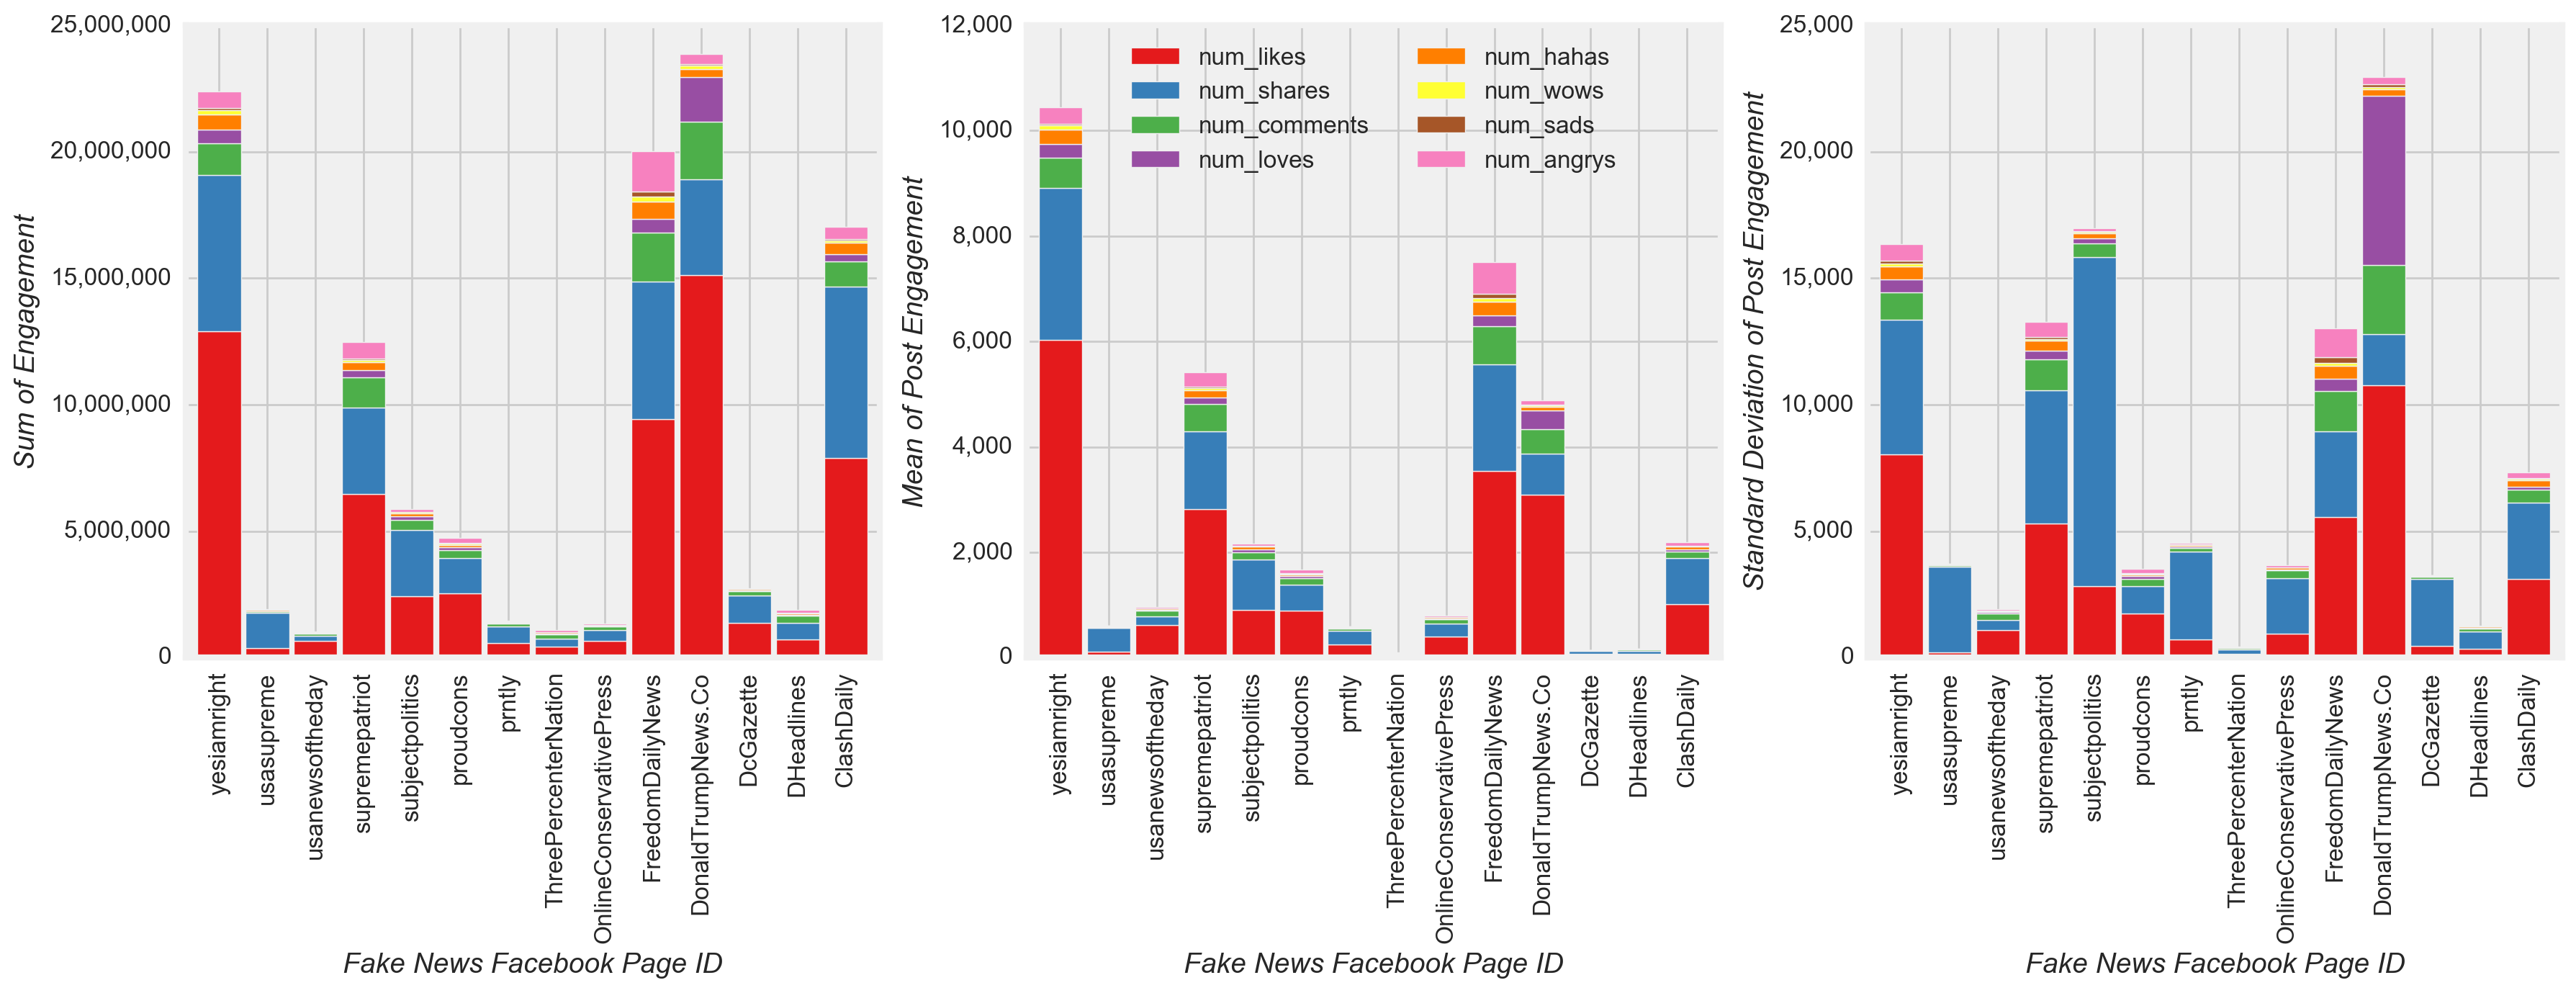
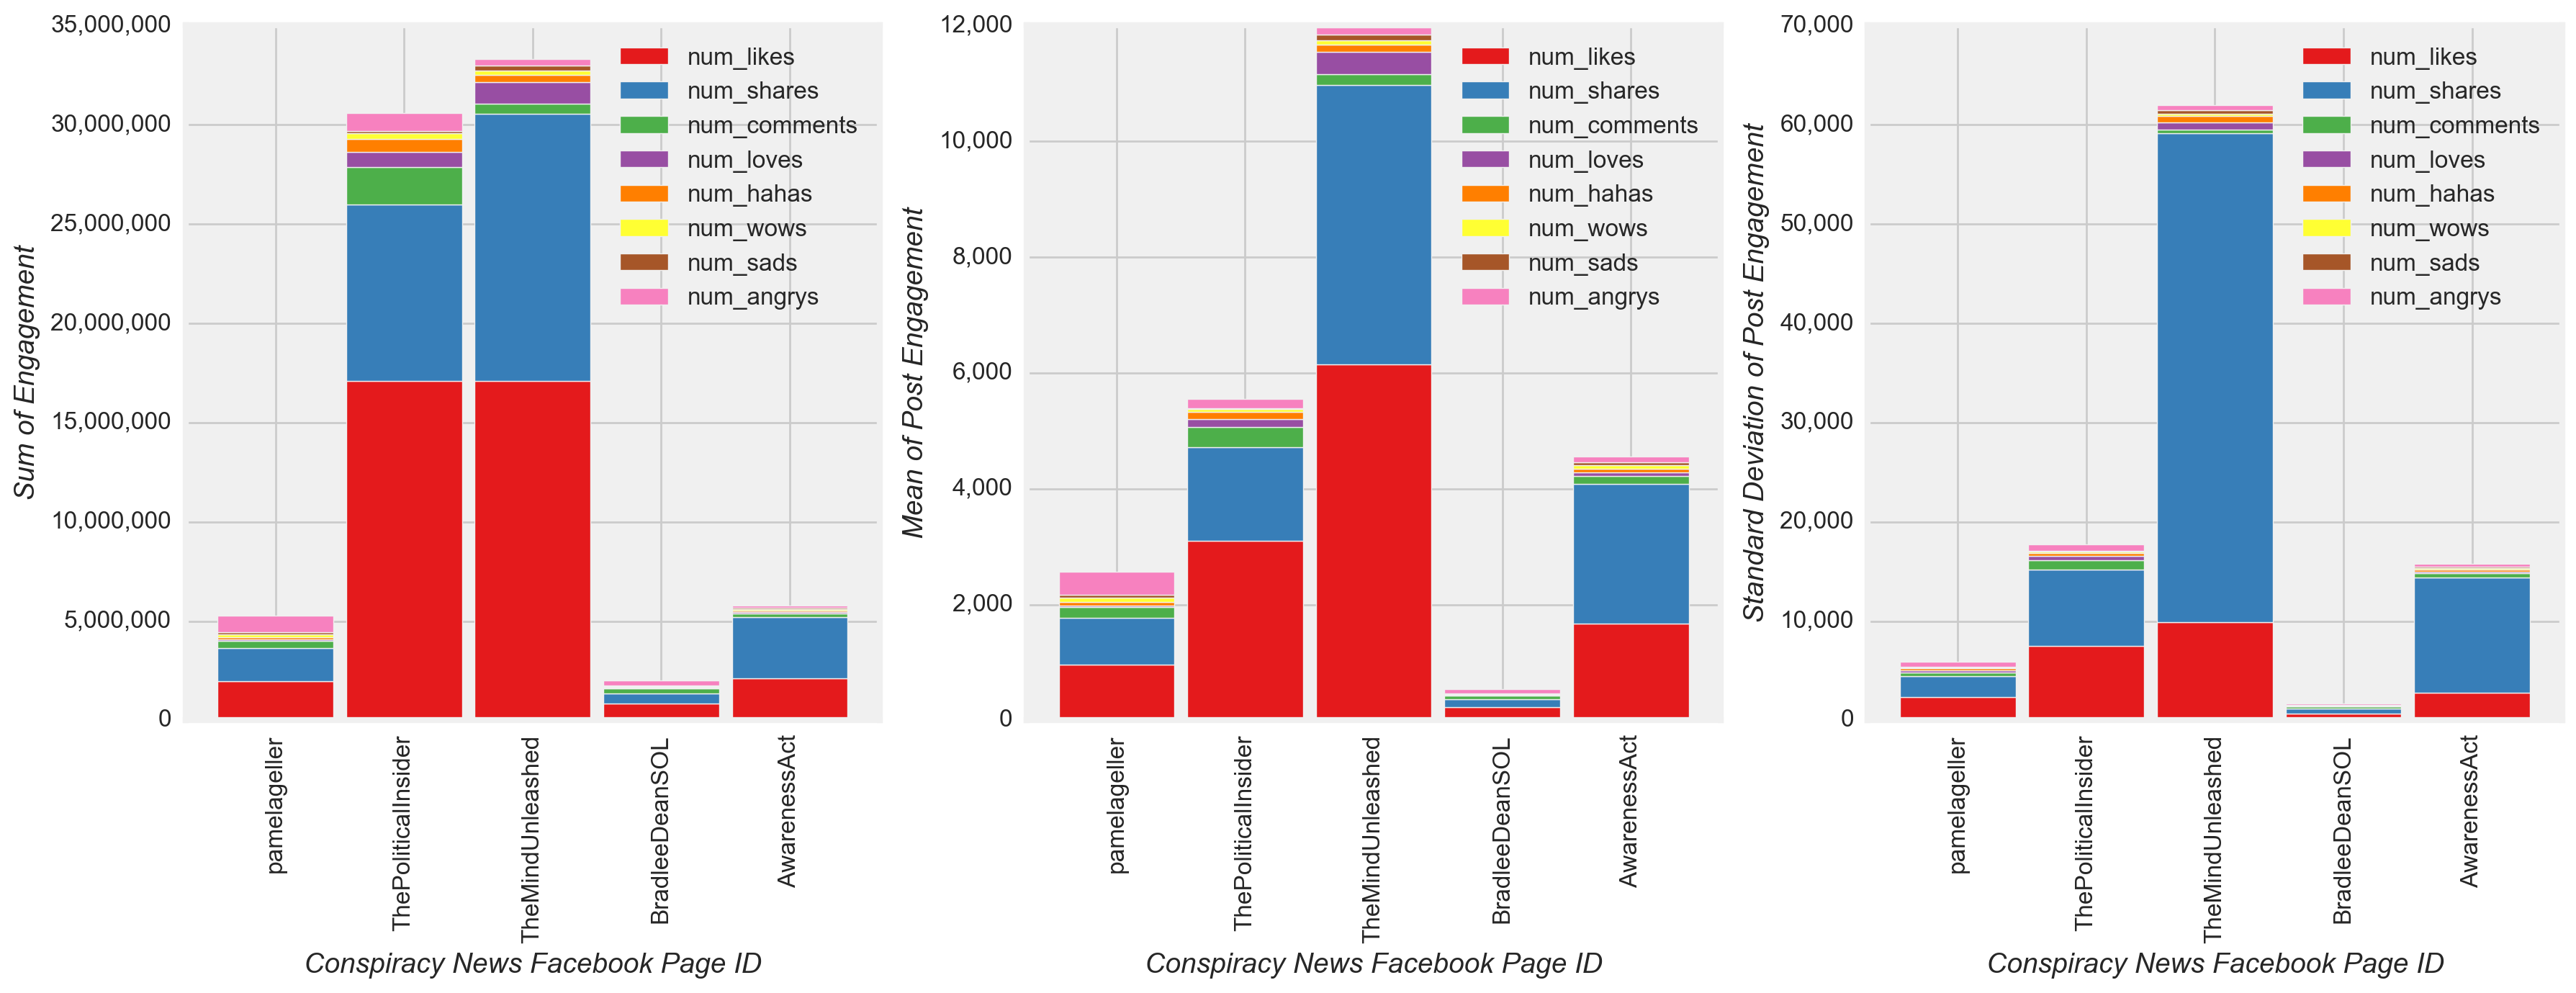
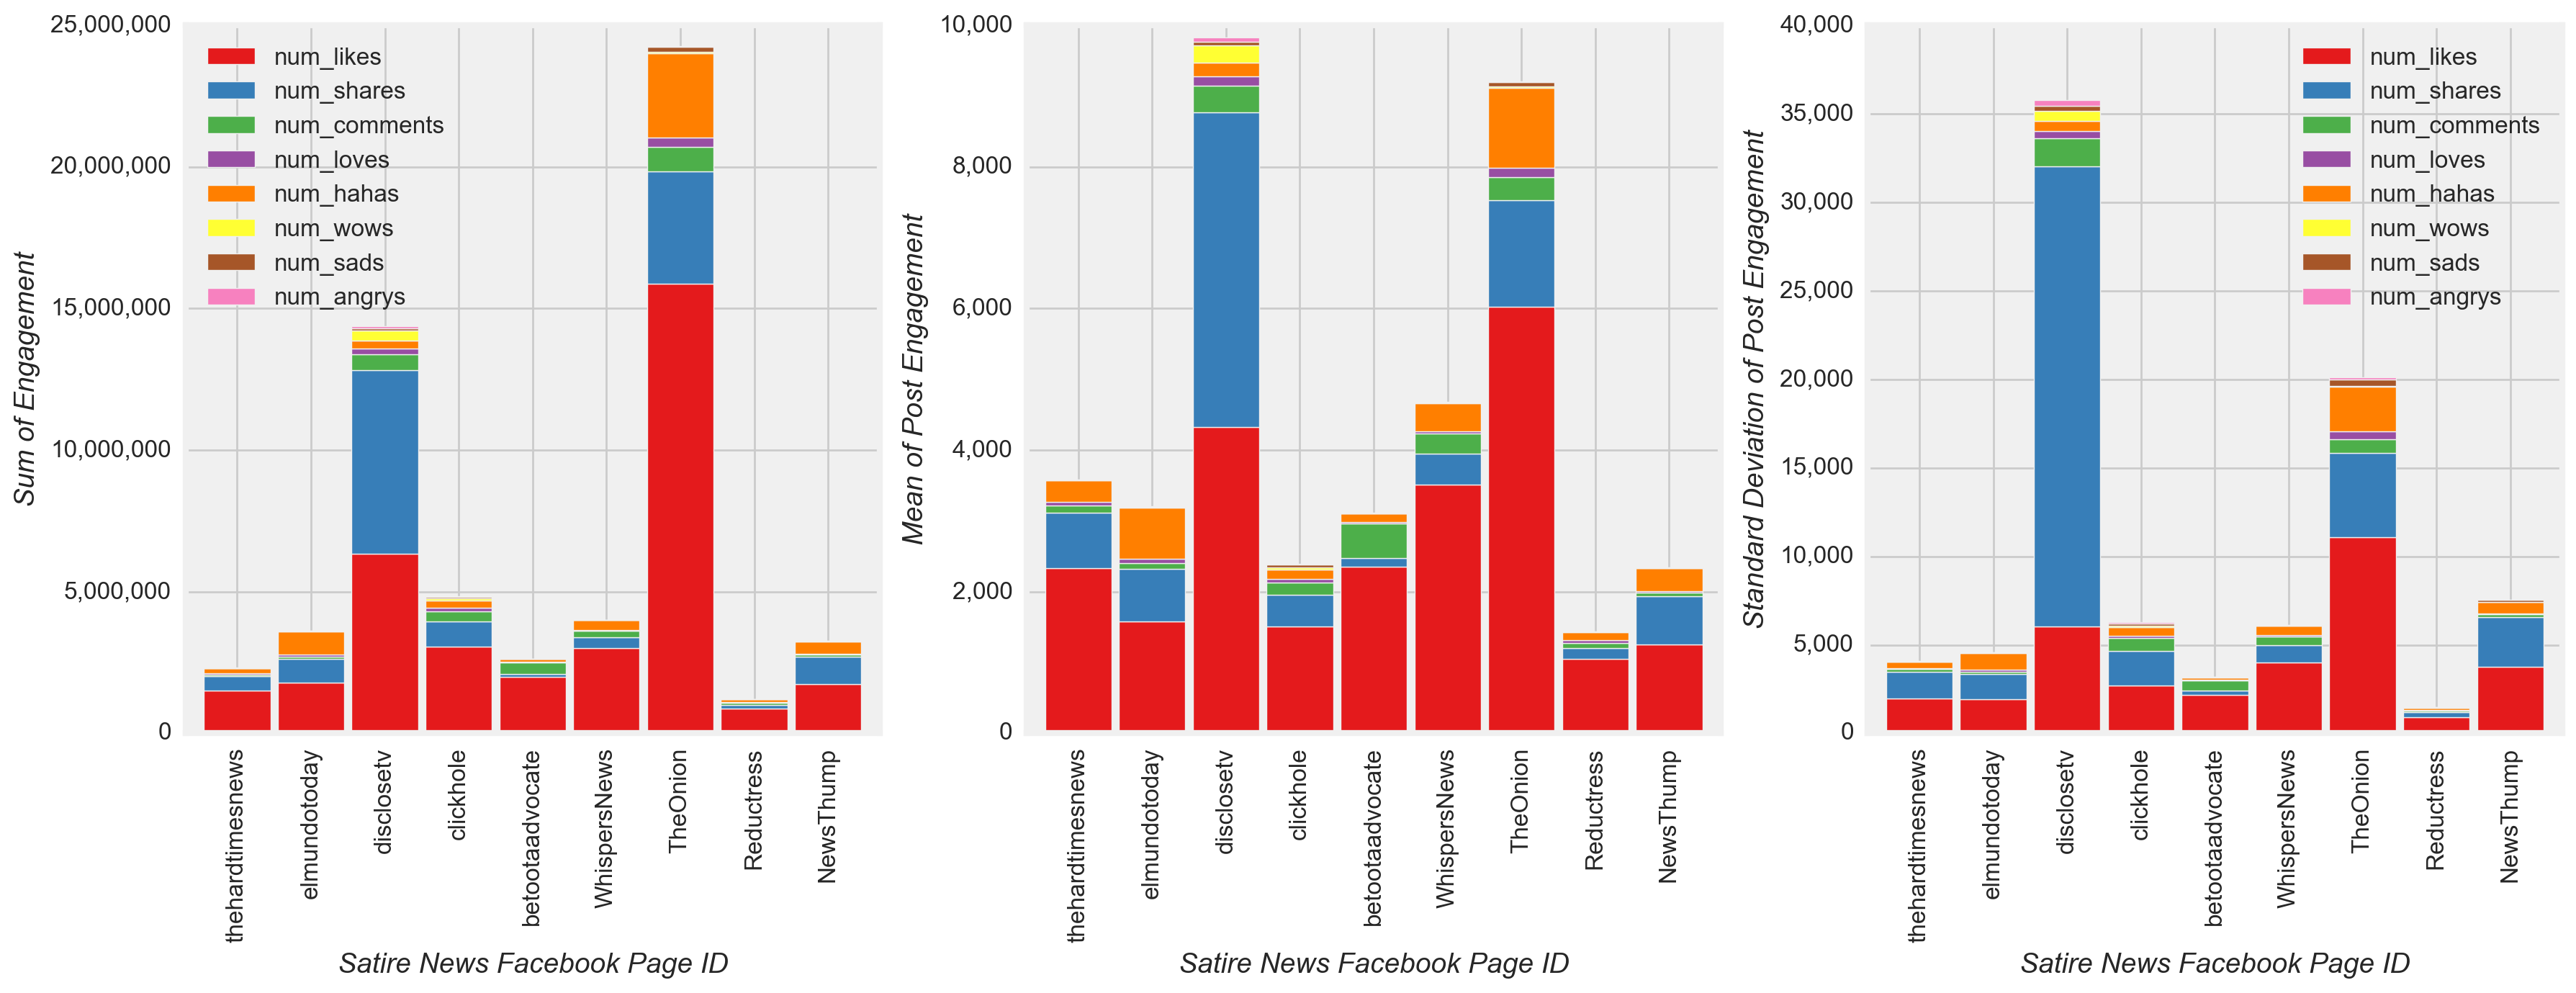
Figure 11
The remaining predictors included in the model were important monograms and bigrams selected from post messages for each type of news. These n-grams were selected such that the maximum number of distinct words used in post messages were extracted as well as the most commonly used words that were unique among each type of news. Nonetheless, only 2% (mainstream) to 29% (satire) of all posts actually contained message text depending on the type of news. Therefore, the inclusion of monograms and bigrams in the model risked adding a considerable amount of noise, given that the training set was considerably smaller than the number of posts in the training dataset. Hence, the coefficients associated with important monograms and bigrams in the final model were reviewed with a greater degree of skepticism than with the previously discussed model predictors and not discussed in the model evaluation.
EDA Summary
- Only a handful of pages posted and received the majority of the engagement regardless of the type of news (Figure 3).
- With respect to the second most frequent type of attachment in posts, mainstream pages posted videos more frequently than all other types of news (Figure 4).
- The most drastic change in posting volume occurred in the form of a reduction in fake news after the election, in large part due to a reduction in post volume among the top three most prolific sources (Figure 5 and Figure 6).
- Regardless of the type of news, a noticeable dip in the volume of posts and engagement activity levels occurred on Saturday and Sunday relative to other days of the week (Figure 8).
- Posts peaked during working hours when considering the four time zones spanning the lower 48 U.S. states irregardless of the type of news (Figure 9).
- Perhaps unsurprisingly, satire had a noticeably higher mean number of hahas per post compared with the mean number of hahas per post for other types of news (Figure 10).
- The proportion of shares in response to fake and conspiracy posts appeared to be greater relative to the proportion of shares among mainstream and satire news (Figure 11).
Model Building
Correlations of the main quantitative predictors were examined to determine the appropriate setting for regularization in the final model. When examining correlation heat maps, no strong correlations appeared between engagement activities and/or between time periods (i.e. hour or day of week) regardless of the type of news (Figure 12). Therefore, regularization with lasso appeared to be a suitable setting in the final model.
When evaluating correlations for each type of news, mainstream news had relatively high correlations between haha and comment (positive correlation [+]), angry and comment (+), wow and share (+), love and like (+), like and comment (negative correlation [-]), like and share (-), wow and like (-), haha and like (-), sad and like (-), and angry and like (-) (Figure 13). Fake news had relatively high correlations between angry and comment (+), and like and share (-). Also, satire news had relatively high correlations like and share (-).
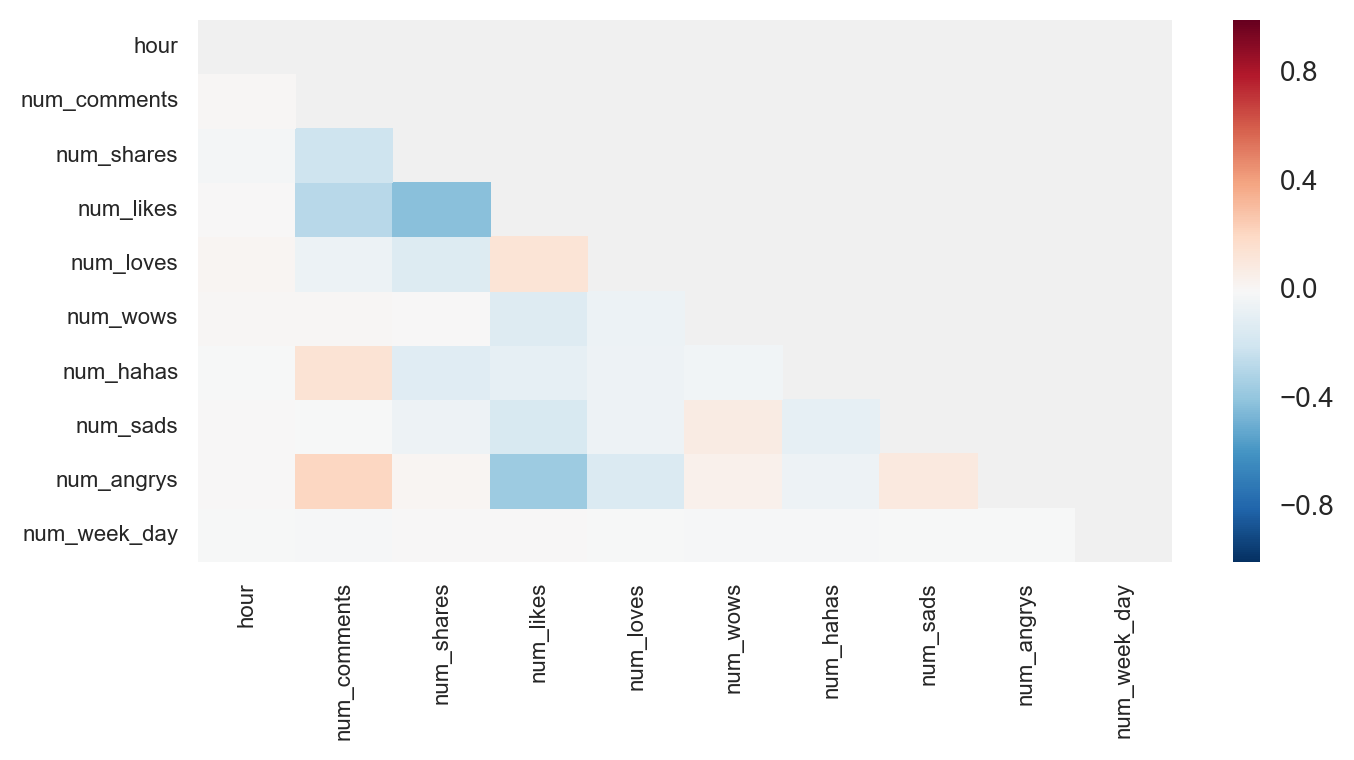
Figure 12
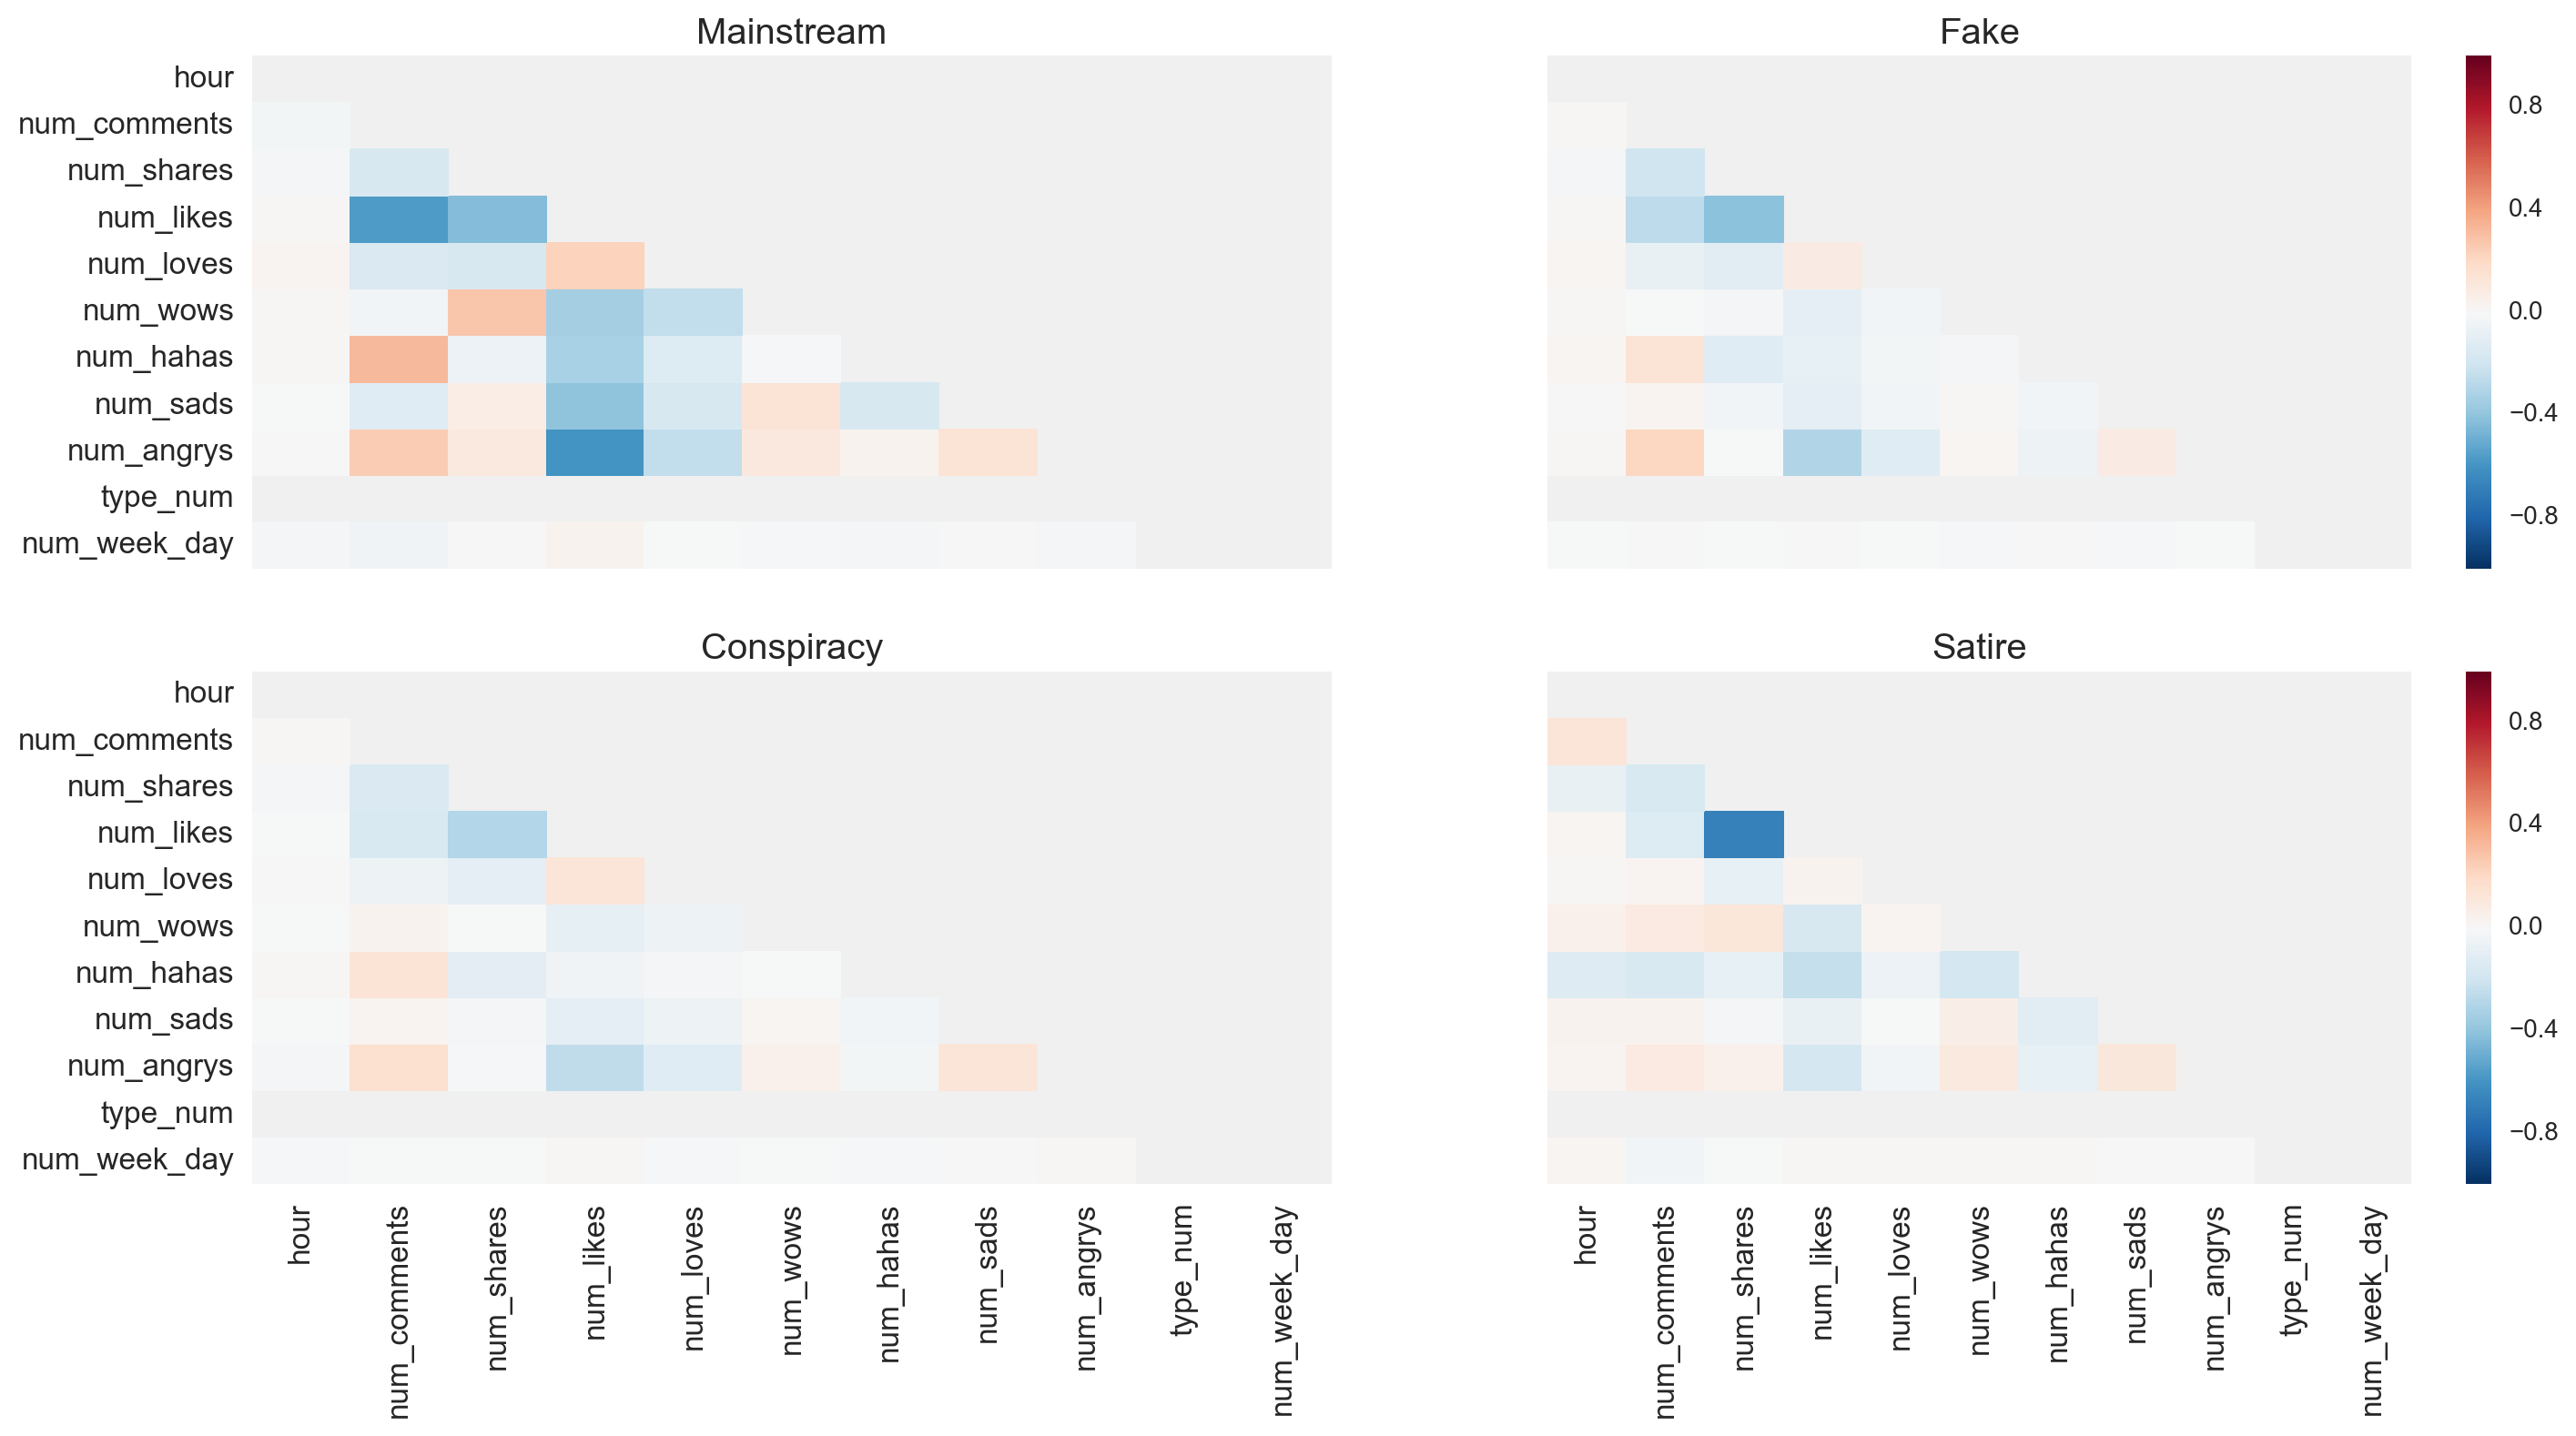
Figure 13
A logistic regression model was selected in this project in order to categorize the news by type using categorical and numeric predictors. Compared to other models such as Naive Bayes, regression models generate coefficients with magnitudes indicating relative importance of predictors. All default settings for the logistic regression model in Scikit-Learn were maintained except for the specification of lasso regularization as justified above and an increase in the maximum number of iterations for model convergence.
Model Results and Evaluation
The final model performed with a promising degrees of success. A 57% mean accuracy was achieved on the test dataset with a test-train split of 30%-70%, which translated to an increase of 16% above baseline. The areas under the receiver operating characteristic (ROC) curves, which shows areas representing individual accuracy scores of each type of news, also looked very good. These areas ranged from 74% (fake and conspiracy) to 86% (satire), indicating success of a model when greater than 50% (Figure 14). Therefore, a quantifiable degree of success was achieved when relying on the source list compiled by Dr. Melissa Zimdars to predict the type of news of a Facebook post from specific post features.
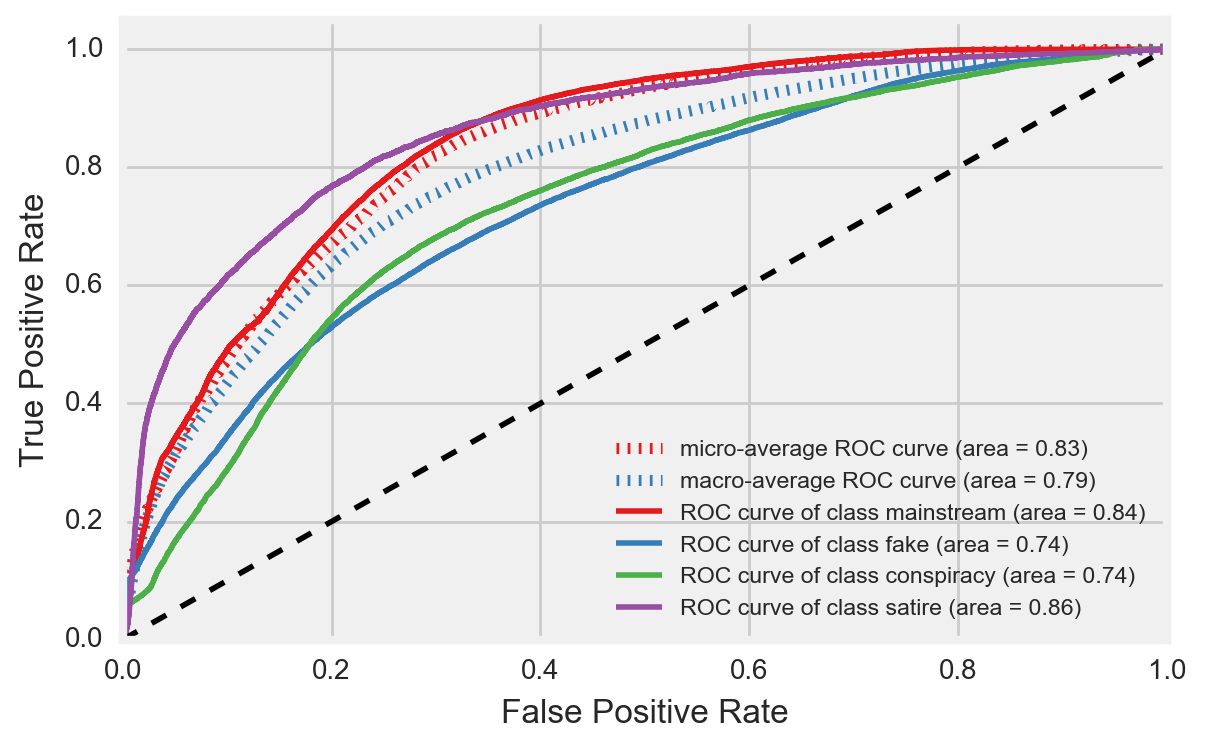
Figure 14
Nonetheless the model showed apparent weaknesses. Precision (i.e. the percentage of correct predictions for a type of news out of the total predictions for that type of news) and recall (i.e. the percentage of correct predictions for a type of news out of the total type of news that really exist) ranged between 53% (satire) and 70% (conspiracy) and between 8% (conspiracy) and 77% (fake), respectively. As shown in (Figure 15), low recall values resulted from the model predicting the majority of the conspiracy and satire posts as mainstream and fake.
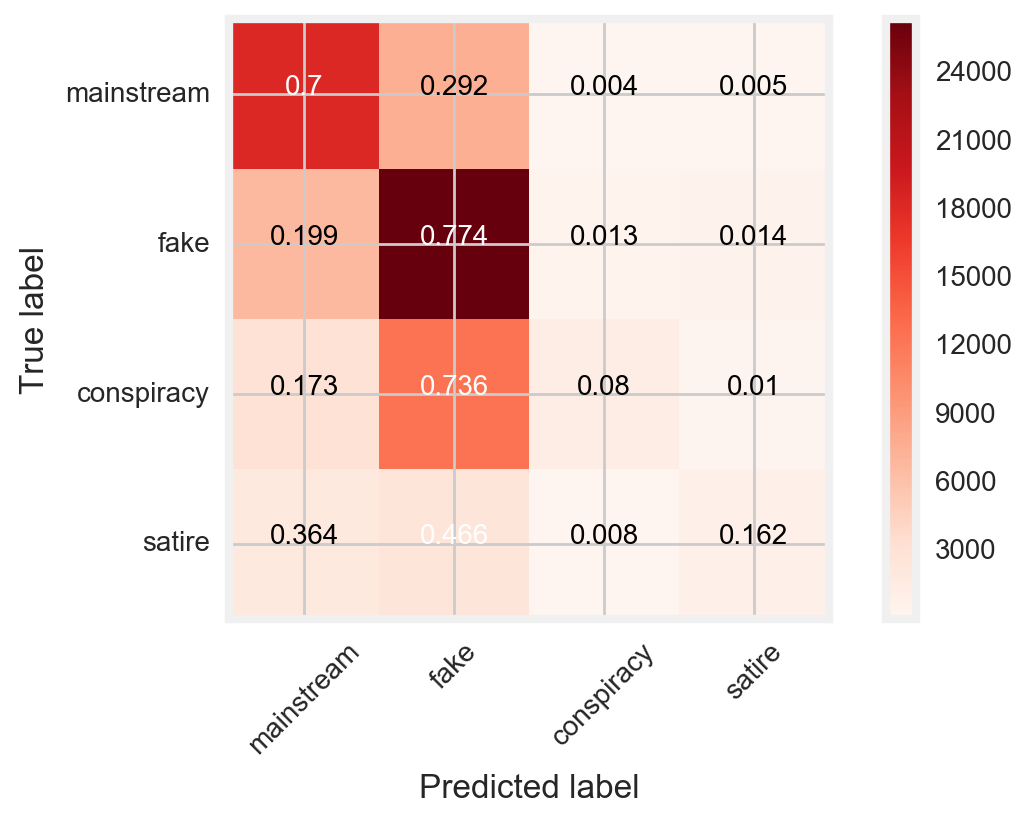
Figure 15
From a page-level view, these low recall results were evident when observing nearly all high and low volume conspiracy and satire pages incorrectly predicting several times the count of correct predictions (Figure 16). Fprnradio (conspiracy) and NewsThump (satire) were an exception to this case, with incorrect and correct counts relatively close. Elmundotoday (satire) and theunrealpage (satire) were also exceptions with the correct prediction count at least double the incorrect count.
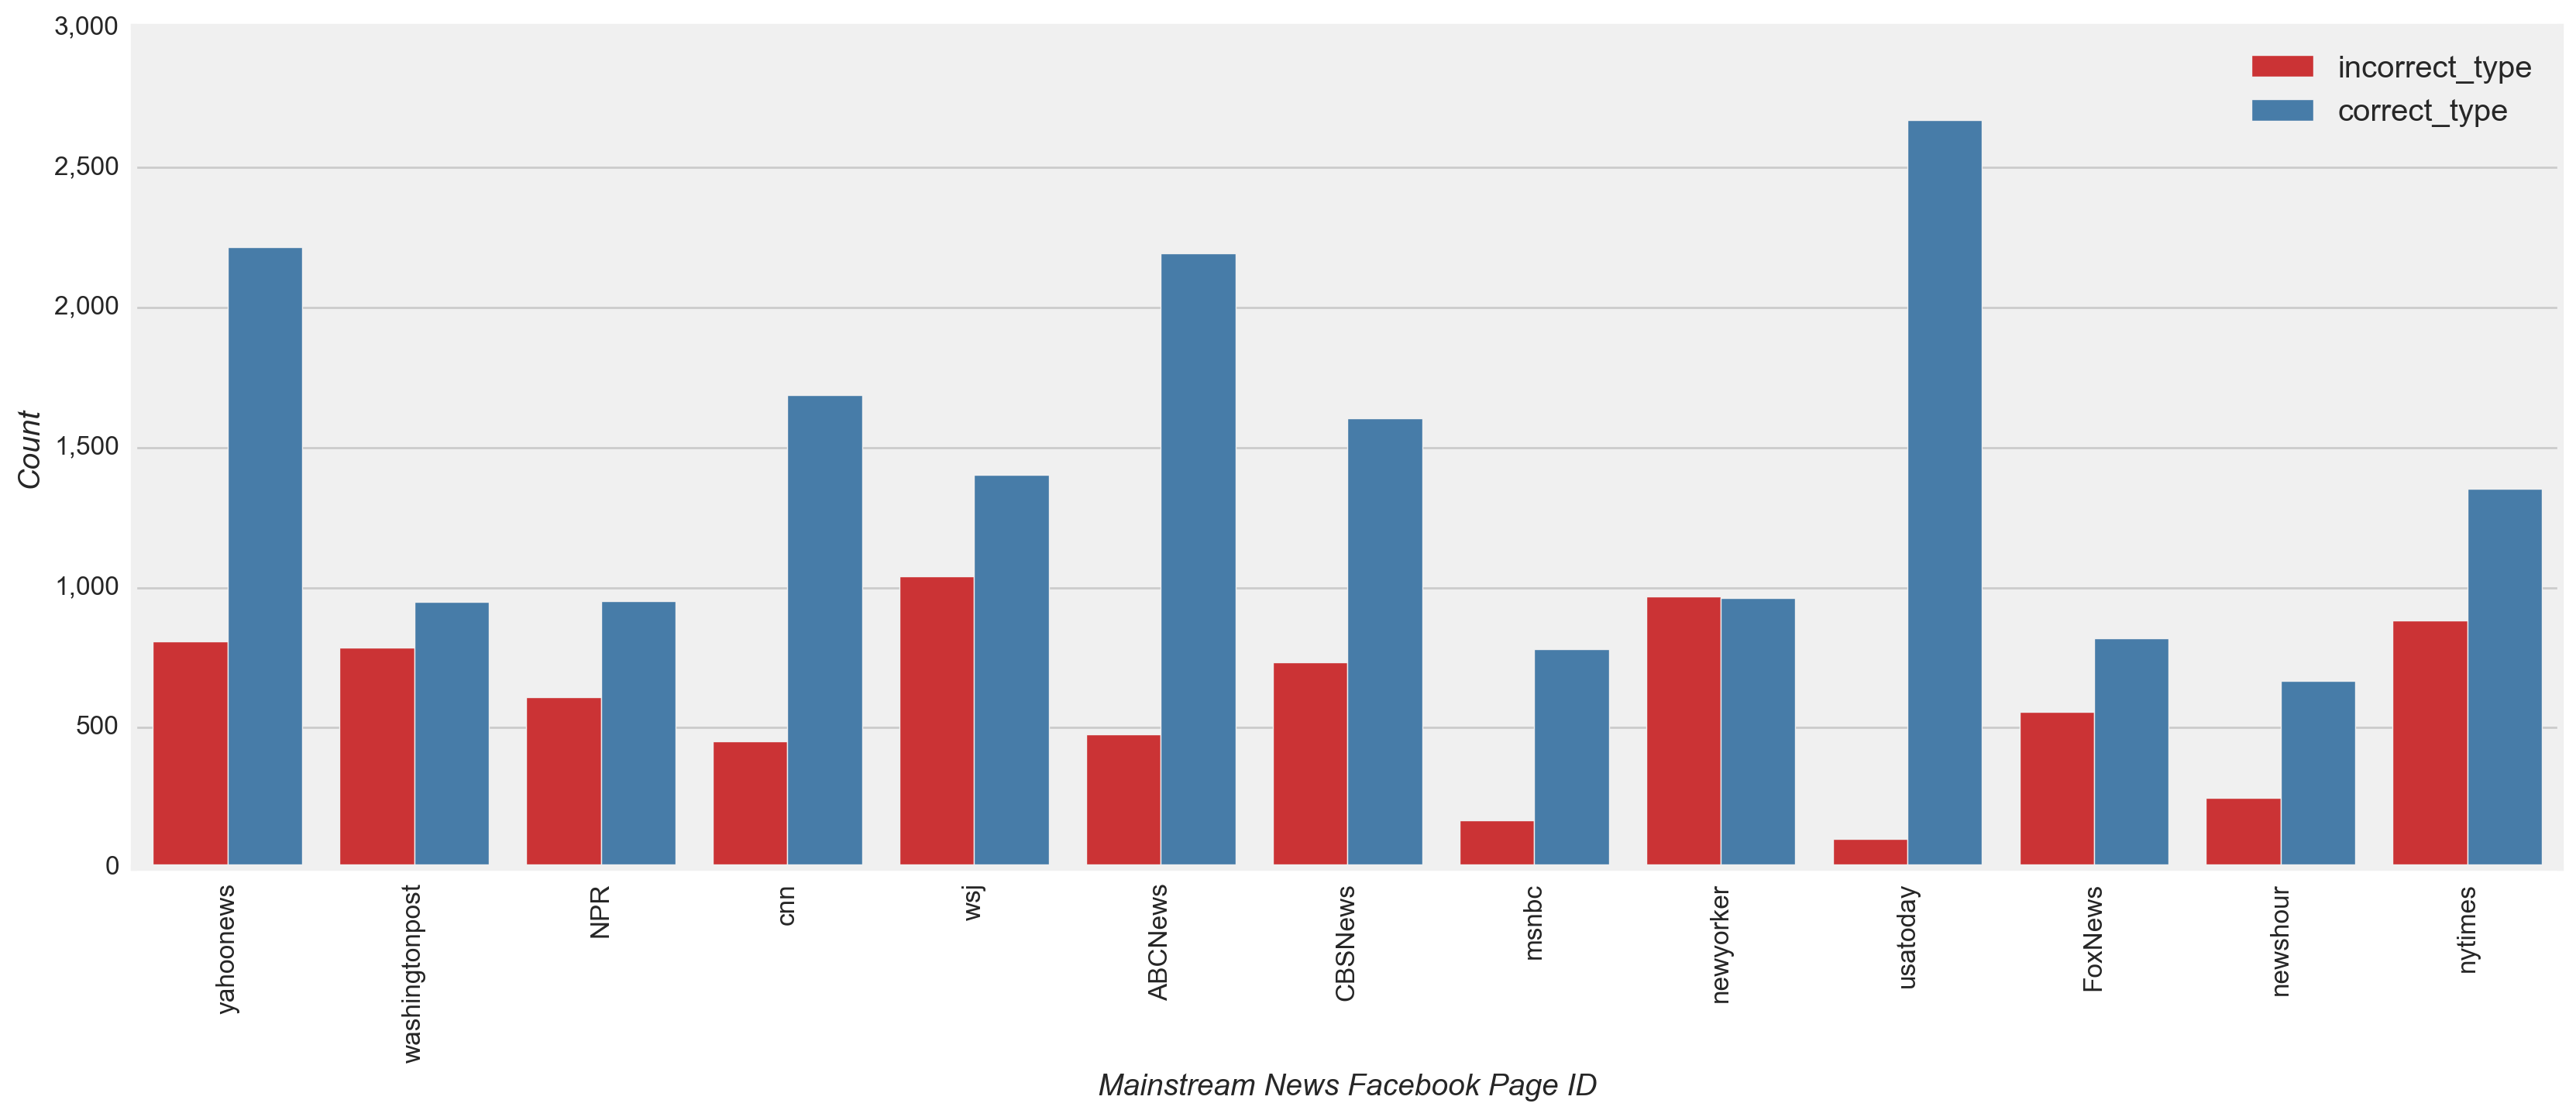
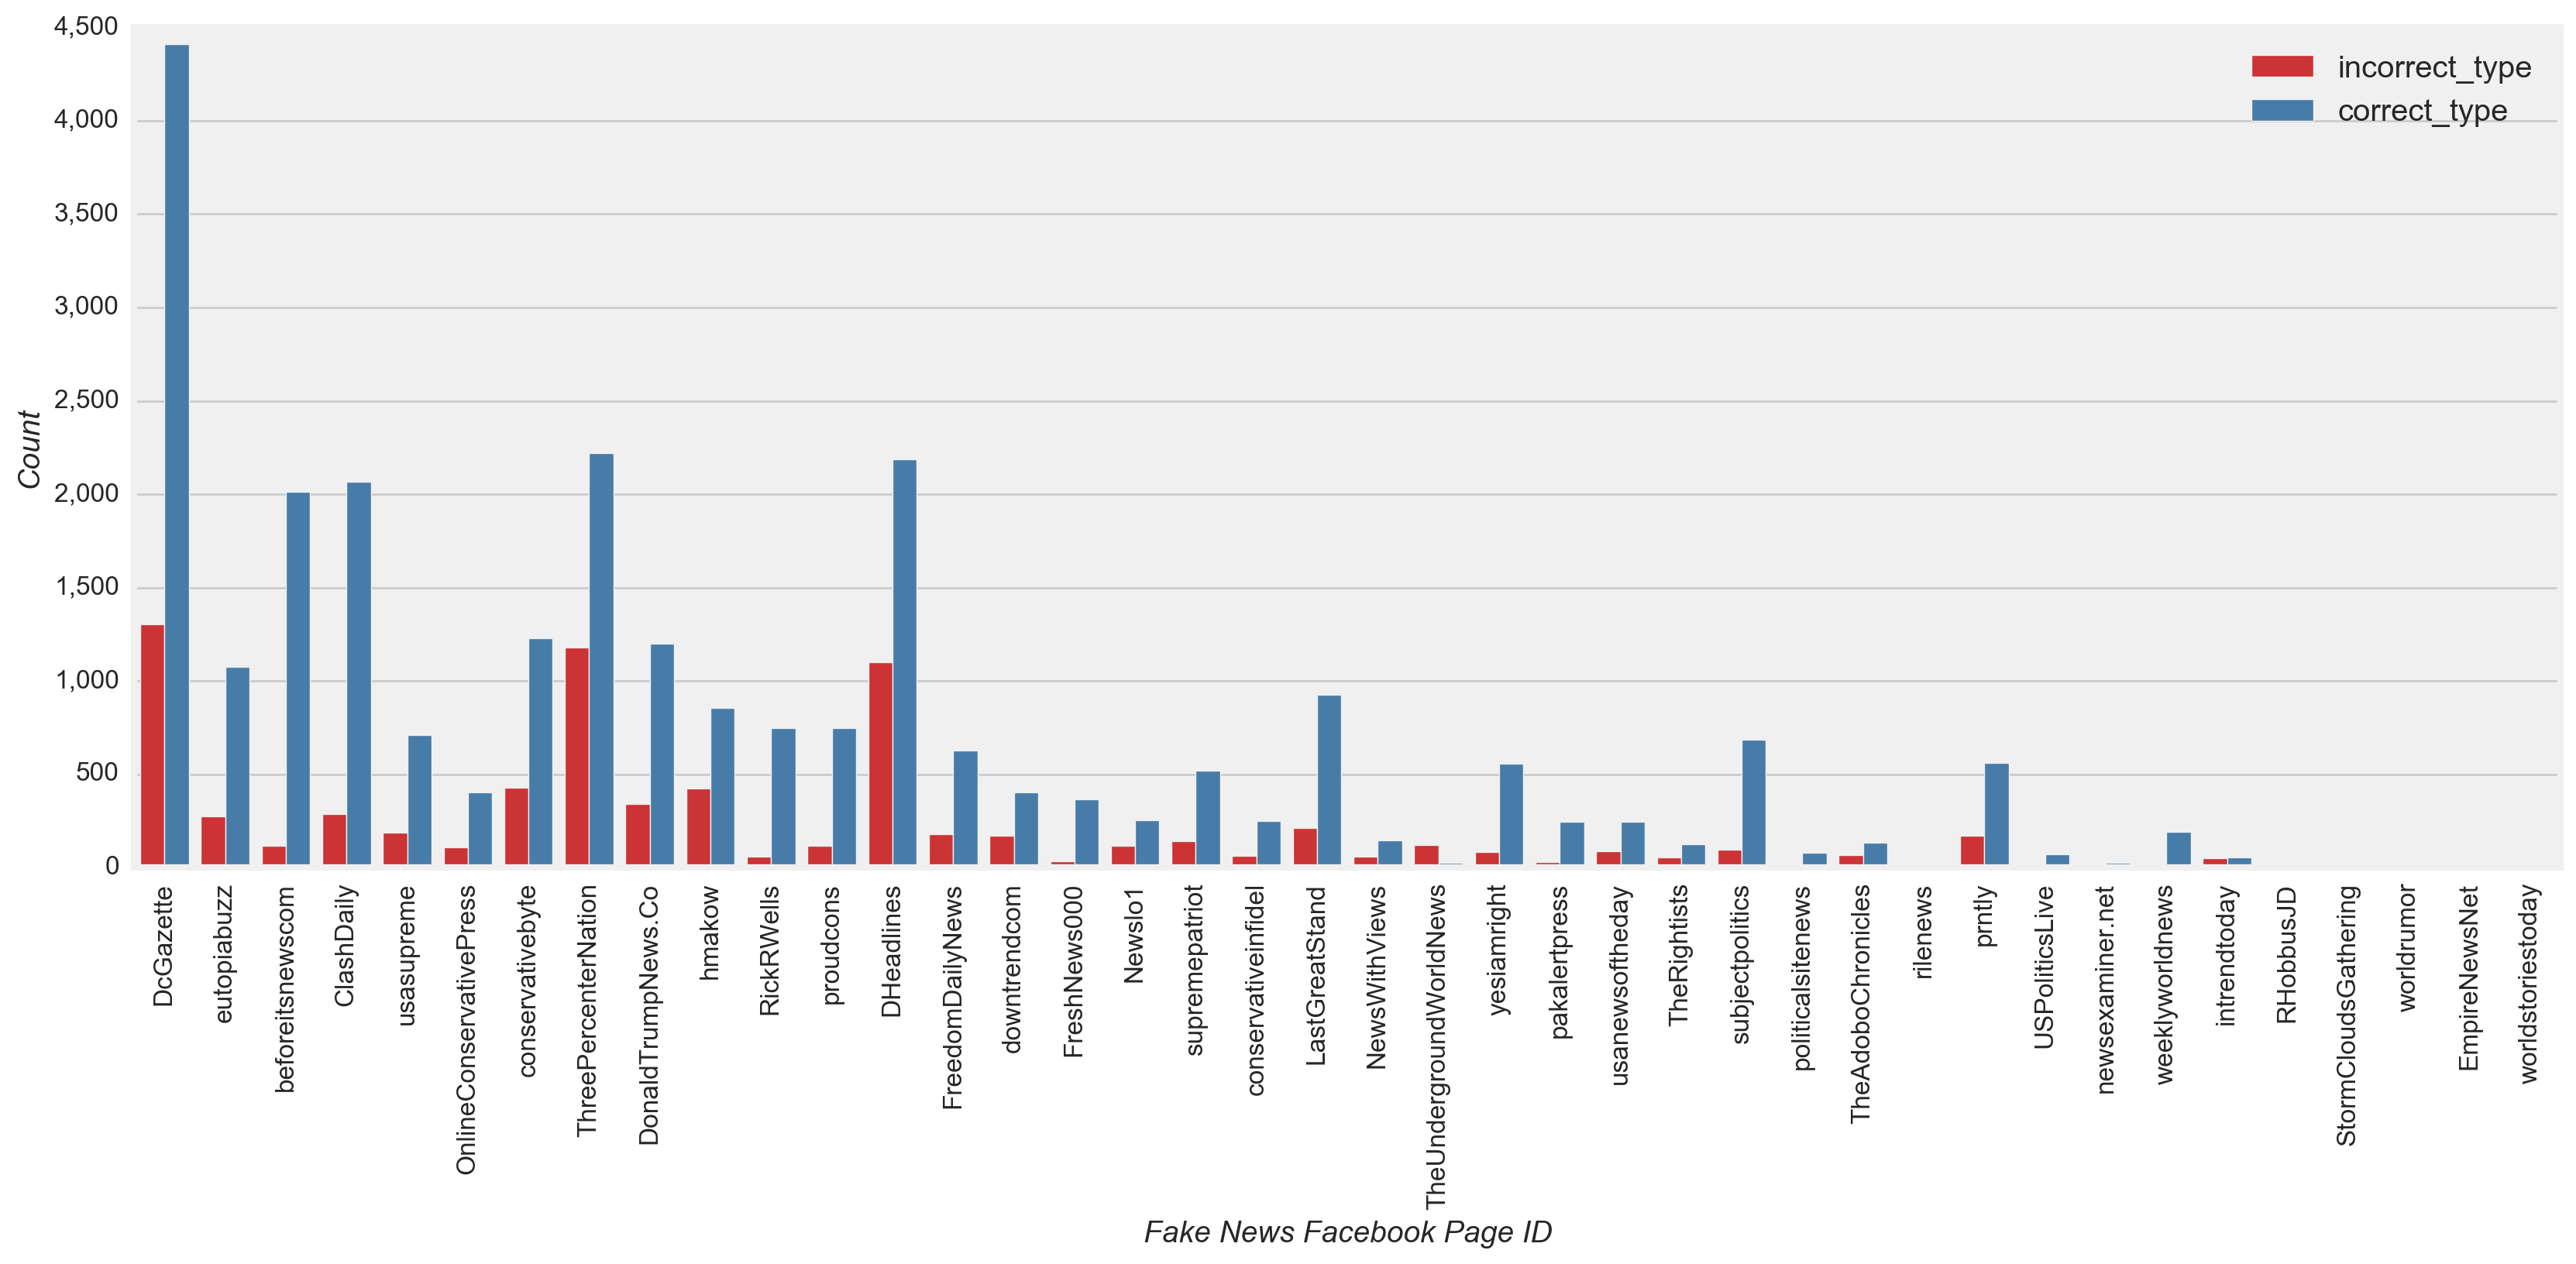
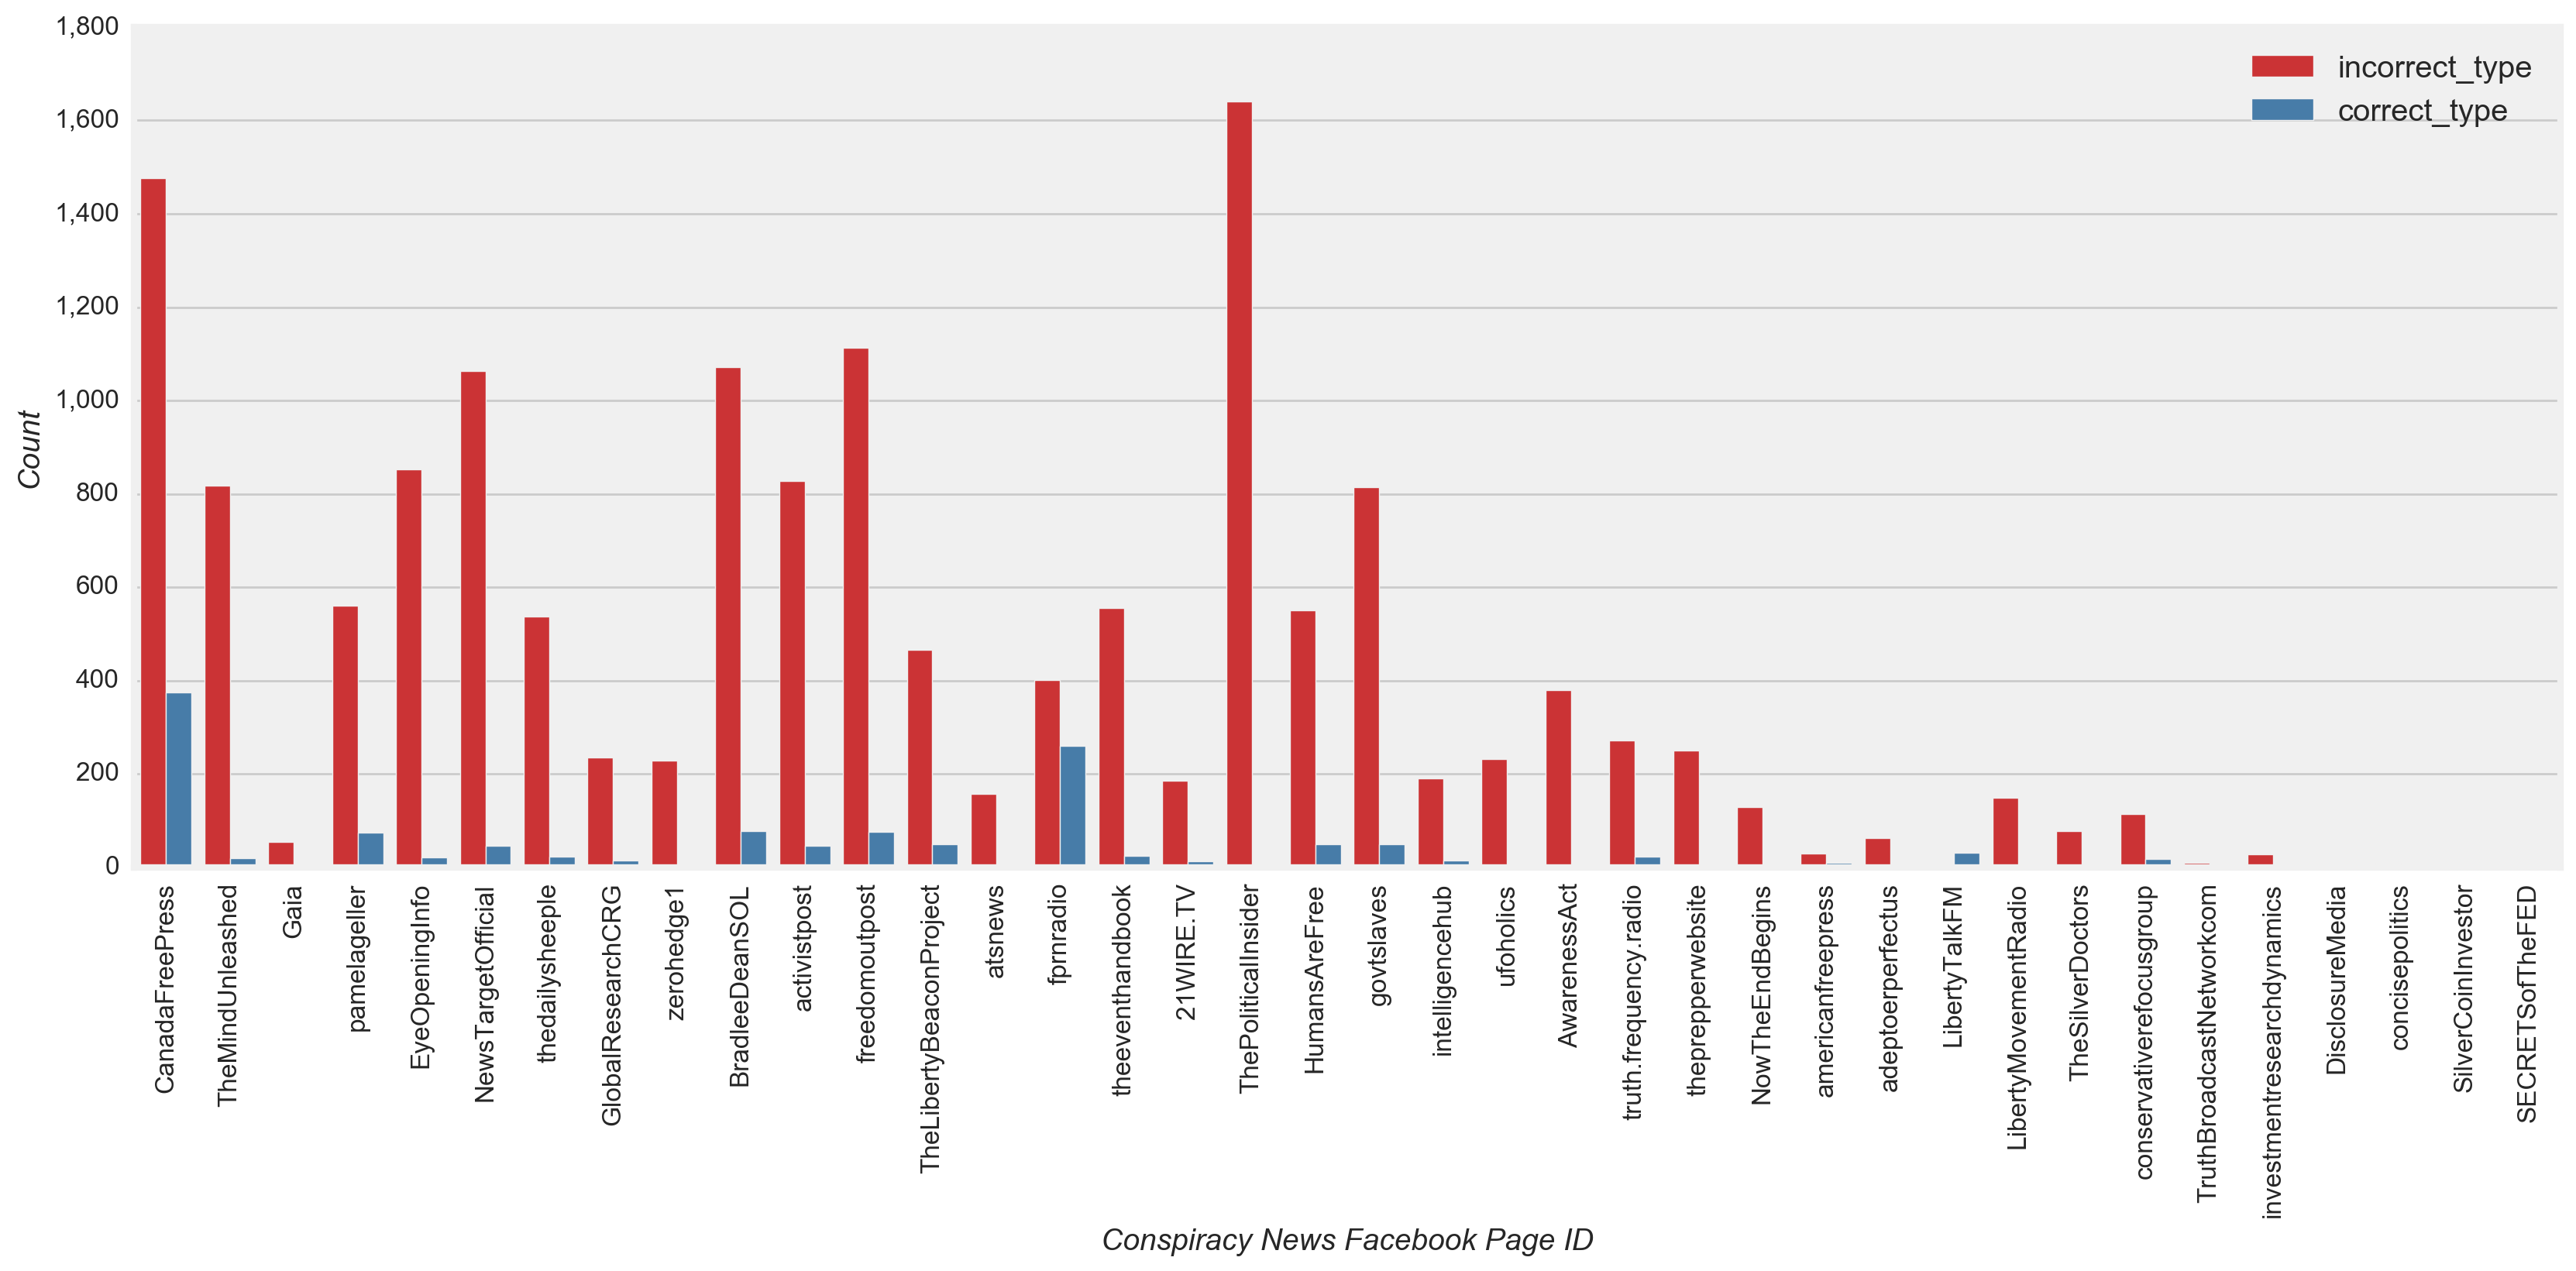
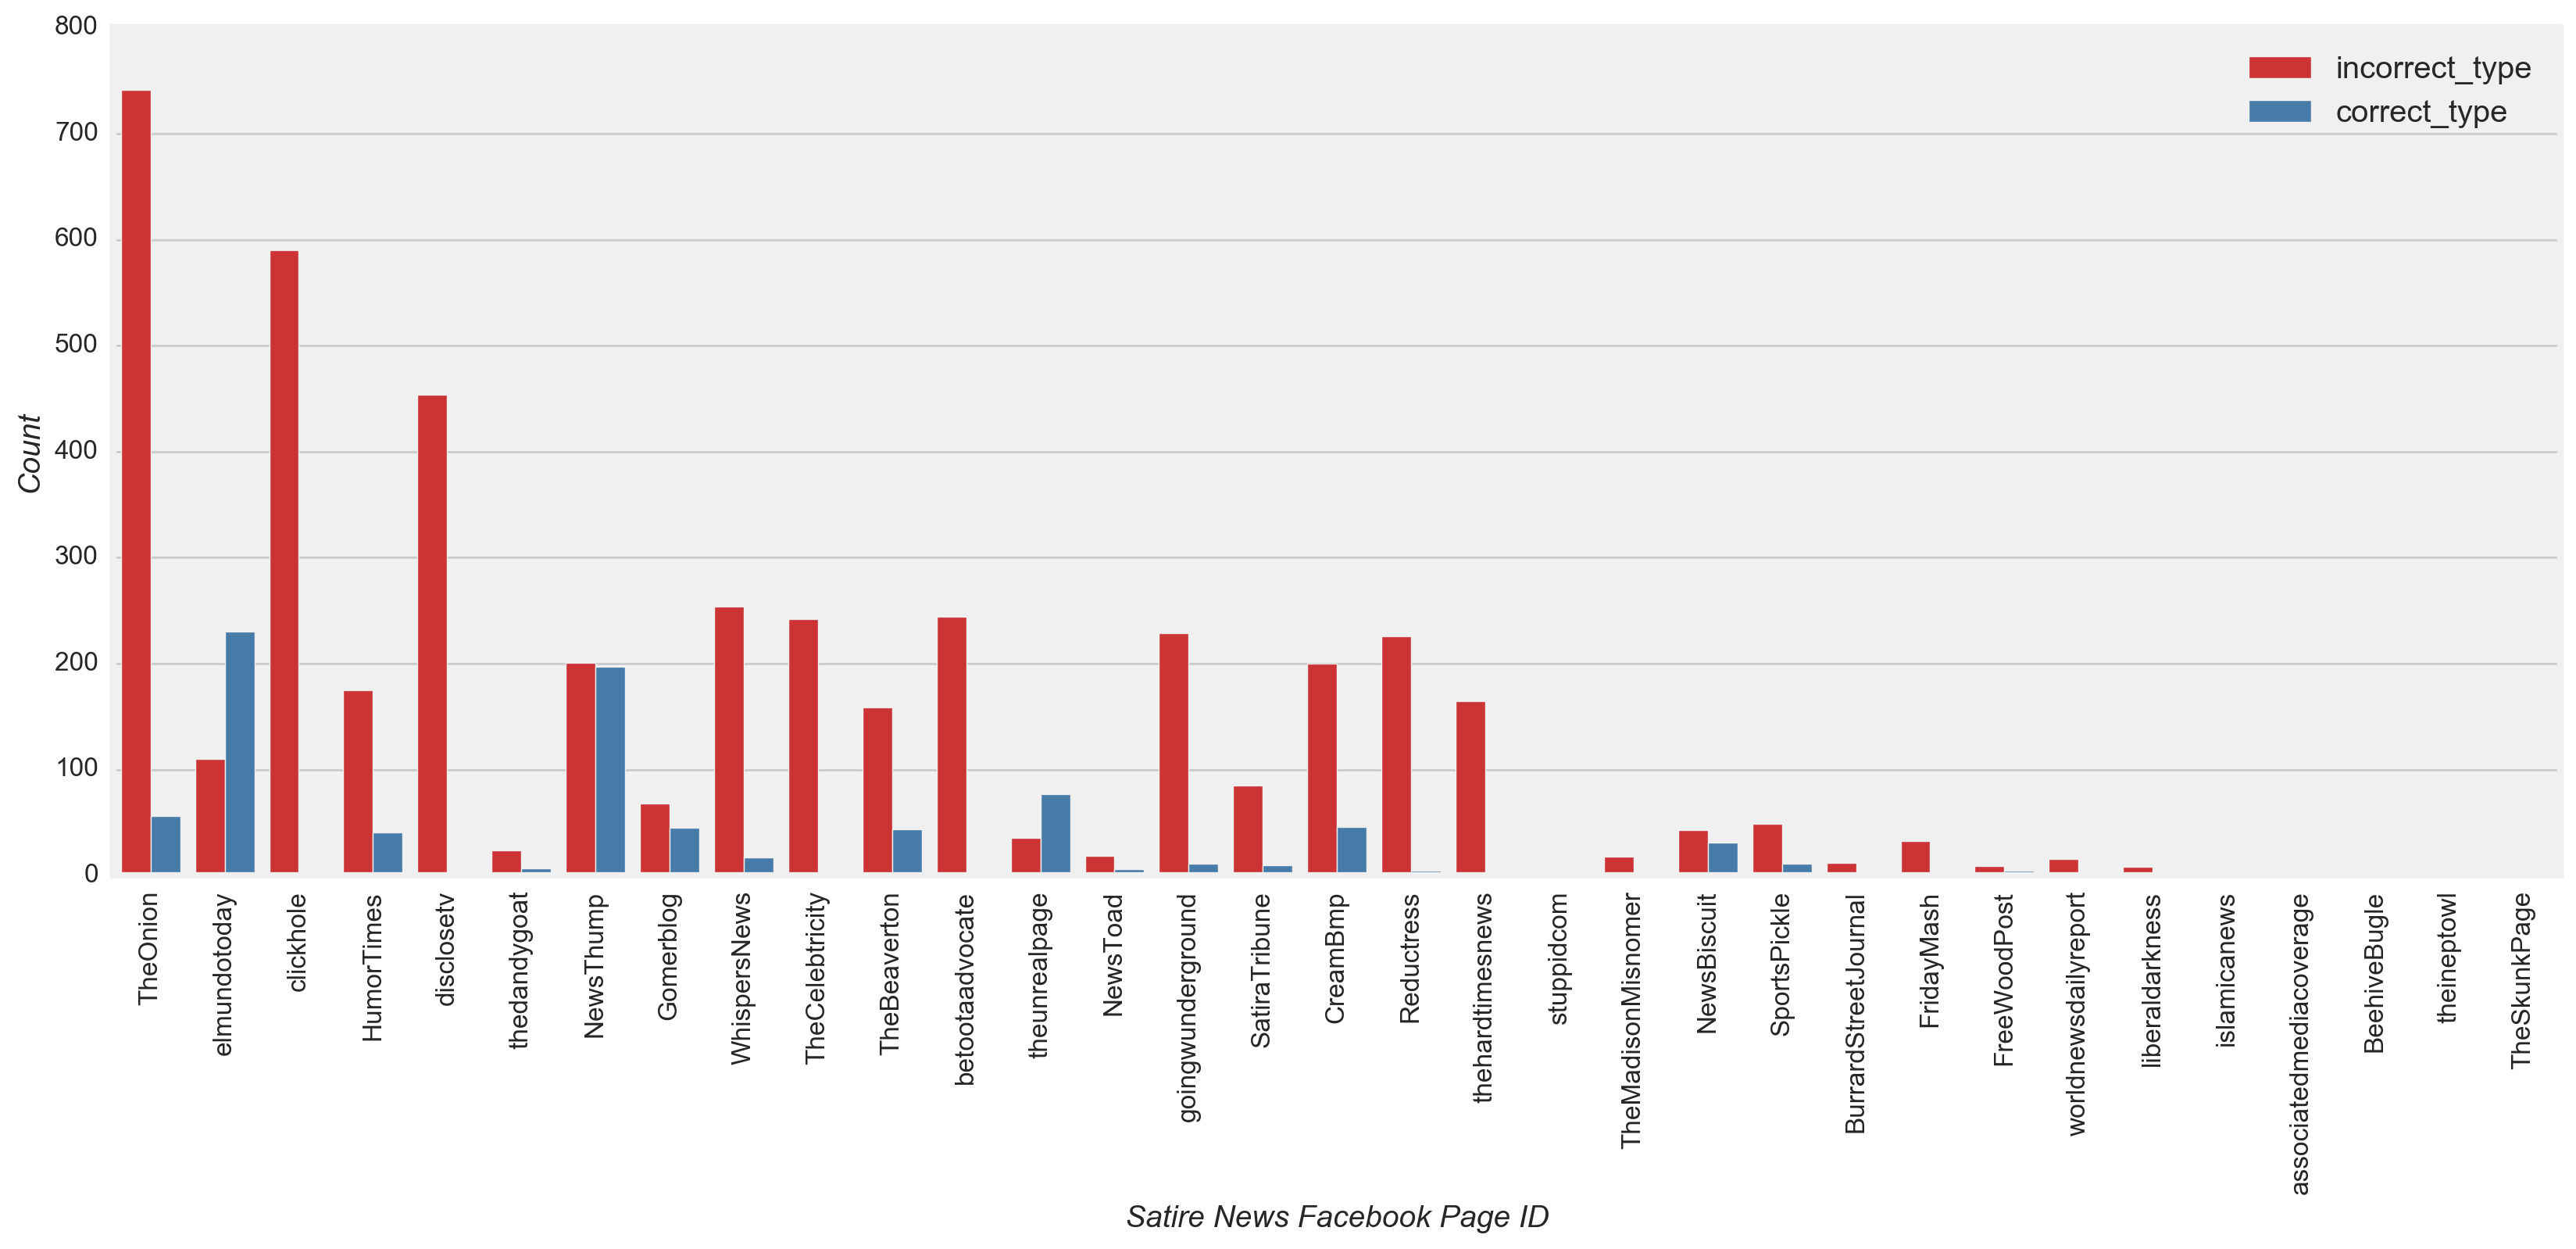
Figure 16
Although all types of news have only a few sources that posted a large portion of the total volume and received much of the engagement (Figure 3), the model did not overfit to the characteristics of the most prolific or engaged pages. Using the test dataset, a review of the classified and misclassified posts by page confirmed this observation. Both high and low volume fake and mainstream news pages were classified as their true class more often than misclassified (Figure 16), i.e. for 77% and 70% of posts, respectively (Figure 15). The New Yorker (mainstream) was one exception, with slightly more misclassified (Figure 16). Also, nearly all the posts for high and low volume conspiracy and satire pages were misclassified several times more than than the correctly classified posts.
Overall, the highest model coefficients were largely associated with types of engagement (60% of the top twenty coefficients, i.e. the highest five coefficients for each of the four types of news)(Figure 17). The highest model coefficients by type of news are listed below. The most distinct coefficients among those listed for each type of news are indicated by ^ and |^|. ^ indicates that the coefficient value is the highest among the corresponding coefficients for the other type of news with the same sign [+ or -]. |^| indicates the same meaning as ^, but doesn’t consider the sign.
- Mainstream news: likes (+2.141 |^|, i.e the absolute value of the likes coefficient value for mainstream news is greater than the likes coefficient for all other types of news), comments (+1.122 |^|), sads (+1.064 |^|), neverhillary (-0.772 |^|), angrys (+0.622 ^, i.e the positive value of the angrys coefficient for mainstream news is greater than the value of any positive angrys coefficient for any other type of news)
- Fake news: sads (-0.528 ^), President Barack (-0.344 ^), video attachment (-0.344 ^), likes (-0.339 ^), follow president (+0.327 ^)
- Conspiracy news: comments (-0.404 ^), hahas (-0.307 ^), tour tickets (+0.294 |^|), President Barack (-0.283), likes (-0.269)
- Satire news: angrys (-1.993 |^|), hahas (+0.725 |^|), loves (-0.696 |^|), likes (+0.672), neverhillary (-0.549)
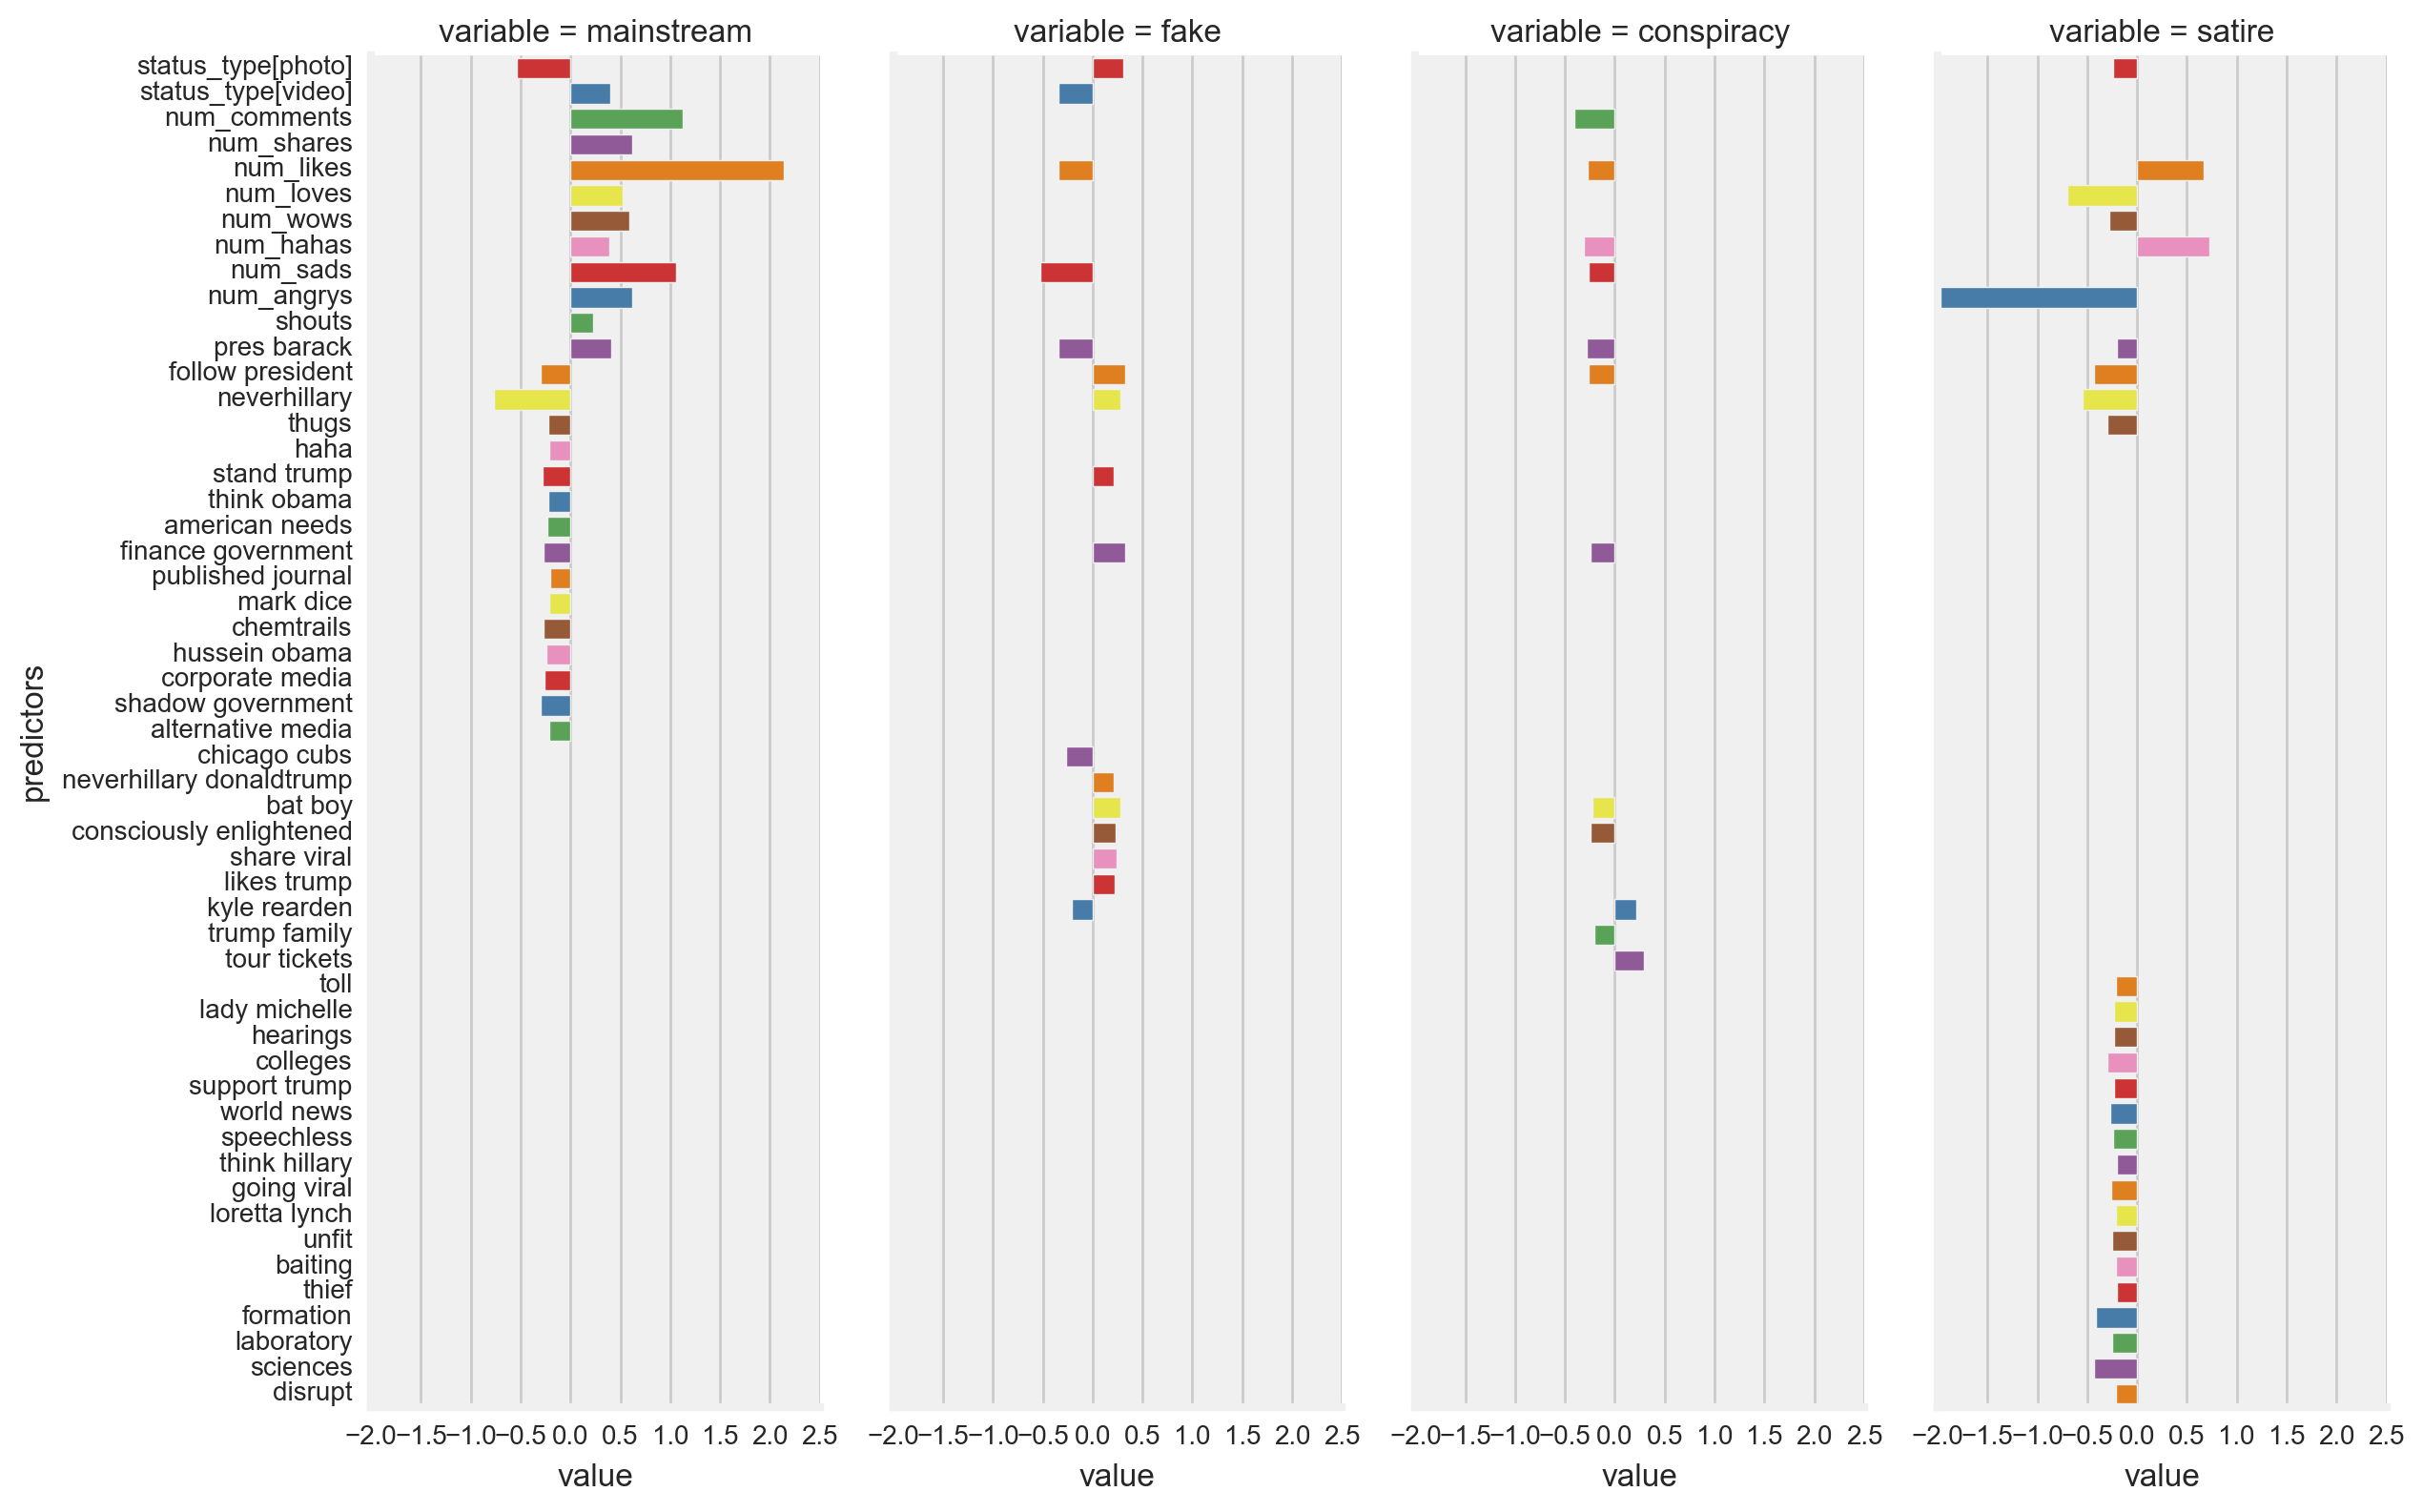
Figure 17
Values of model coefficients were evaluated against observations noted in the above EDA to further assess the performance of the model. These evaluations are summarized in the list below:
- As discussed above, mainstream pages posted videos more frequently than all other types of news (Figure 4). Upon inspection of the model coefficients, this observation was reflected in a relatively high model coefficient for mainstream videos (0.403) compared with video coefficients for other types of news (-0.344 to 0.032)(Figure 17).
- A noticeable reduction in the percentage of posts from fake news was observed after the election (Figure 5). This observation was reflected in a relatively high pre-Presidential Election coefficient for fake news compared with the post-Presidential Election coefficient for fake news (reflected as a 4.5% decrease in the post-Presidential Election coefficient for fake news).
- Furthermore, as expected, due to the low variation of post frequency among different types of news throughout the week (Figure 8), model coefficients for days of the week varied very little among the different types of news (i.e. between -0.078 to 0.080).
- Also as expected, with little difference in the pattern of posts over the hours of the day between different types of news with the exception of satire news (Figure 9), model coefficients for hours of the day for mainstream, fake and conspiracy news were relatively low (-0.025 to 0.059) in comparison to the model coefficient for hours of the day for satire news (-0.138).
- The model also confirms perhaps the least surprising observation. i.e. satire had a noticeably higher mean number of hahas per post compared with the mean number of hahas per post for other types of news (Figure 10). This observation was reflected in the high haha model coefficient for satire (0.725) relative to the haha coefficients for all other types of news (-0.307 to 0.394)(Figure 17).
- When reviewing share coefficients, fake (0.036) and conspiracy news (0.162) actually had lower values than mainstream (0.615) and satire news (0.183). At a page-level view, this result contradicted expectations based on observing a greater proportion of shares in response to highly engaged fake and conspiracy posts relative to the proportion of shares in response to highly engaged mainstream and satire posts (Figure 11). However, upon further inspection, mean shares for mainstream and satire were actually higher than mean shares for fake and conspiracy news (Figure 10), and, for this reason, the reverse of the original expectation is found to be true.
Conclusion
- A quantifiable degree of success was achieved when relying on the source list compiled by Dr. Melissa Zimdars to predict the type of news of a Facebook post from specific post features. A 57% mean accuracy was achieved on the test dataset with a test-train split of 30%-70%-an increase of 16% above baseline-and the areas under the ROC curves indicated a well-performing model on the test dataset (Figure 14).
- Low recall values on the test dataset resulted from the model predicting the majority of the conspiracy and satire posts as mainstream and fake posts (Figure 15 and Figure 16).
- Although all types of news only have a few sources that posted a large portion of the total volume and received much of the engagement (Figure 3), the model did not overfit to the characteristics of the most prolific or engaged pages as confirmed in a review of the classified and misclassified posts by page on the test dataset (Figure 16).
- Overall, the highest model coefficients were largely associated with types of engagement (Figure 17).
- The values of model coefficients confirmed many of the observations described in the EDA, including the more frequent posting of videos by mainstream news (Figure 4), changes in the posting of pre- and post-presidential Election fake news (Figure 5), the low variation in posting among different types of news throughout the week (Figure 8), and the unique characteristics of satire news (i.e. the distinct posting pattern over the hours of the day and the high mean number of hahas per post compared to other types of news) (Figure 9 and Figure 10).
Future Work
- Calibrate and verify the model using more posts, messages, and news pages with a dataset of posts more evenly sampled among types of news than the current dataset. Once calibrated and verified, confirm if the important predictors of the model changed.
- Vary the number and type of words from message texts used in the model. Also, possibly include n-grams from Facebook link names.
- Examine the content of the pre-categorized posts in the dataset and, if necessary, correct the label.
- Evaluate other feature engineering options to compare against the performance of Lasso regularization.
- Use GridSearch to vary the degree of regularization (i.e the C parameter).
More Information
For more information, please refer to the technical report with Python Code or the presentation I gave recently. Extensions of this work can also be viewed on Tableau Public.